## packages and tools
library(tidyverse)
library(peacesciencer)
source(
  "https://raw.githubusercontent.com/milesdwilliams15/death-destruction-data/refs/heads/main/helpers/peacesciencer_extras.R"
)
## create leader-day dataset
create_leaderdays(standardize = "cow") -> ldrs

## read in MIE dataset
read_csv(
      "https://raw.githubusercontent.com/milesdwilliams15/foreign-figures/refs/heads/main/_data/mie-1.0.csv"
) -> mie

## aggregate to the MIC level
mie |>
  mutate(
    stday = ifelse(stday < 0, 1, stday),
    date = paste0(styear, "-", stmon, "-", stday) |> ymd()
  ) -> mie
mie |>
  group_by(ccode1, date, micnum) |>
  summarize(
    mineventnum = min(eventnum),
    miconset_init = (mineventnum == 1) + 0,
    events_init = n()
  ) |>
  group_by(ccode1, micnum) |>
  mutate(
    events_init = sum(events_init)
  ) |>
  filter(miconset_init == 1) |>
  ungroup() |>
  rename(
    ccode = ccode1
  ) |>
  group_by(ccode, date) |>
  summarize(
    miconset_init = 1,
    events_init = sum(events_init)
  ) |>
  ungroup() -> mics

## merge by date and ccode
ldrs |>
  left_join(mics) -> ldrs

## add 0s
ldrs |>
  mutate(
    across(ends_with("init"), ~ replace_na(.x, 0))
  ) -> ldrs

## aggregate to the leader-year
ldrs |>
  mutate(
    year = year(date)
  ) |>
  group_by(ccode, leader, year) |>
  summarize(
    miconset_init = max(miconset_init),
    events_init = sum(events_init)
  ) |>
  ungroup() -> lydt

## conflict data (will let me get peace spells)
create_stateyears(
  subset_years = 1816:2014
) |>
  add_icd_mics() -> micdt

micdt |>
  select(ccode, year, micspell) -> micdt

## get willingness to use for data
create_leaderyears(
  standardize = "cow"
) |>
  filter(year %in% 1875:2004) |>
  add_lwuf() -> lddt

## get controls
create_stateyears() |>
  add_cow_majors() |>
  add_contiguity() -> controls

## merge everything together
lydt |>
  left_join(
    lddt, by = c("ccode", "leader", "year")
  ) |>
  left_join(
    micdt, by = c("ccode", "year")
  ) |>
  left_join(
    controls, by = c("ccode", "year")
  ) -> dt

## right coverage
dt |>
filter(year %in% 1875:2004) -> dt10 Leaders and War
Main ideas:
Leaders matter for war, not just structural factors like alliances or trade.
“Hawks” favor aggressive foreign policy; “doves” prefer restraint. A latent measure of leader willingness to use force was developed by Carter & Smith using Bayesian item response theory for capturing these ideas.
The measure draws on psychological traits, political orientation, and personal background/experience.
Hitler, Mussolini, Franco, and Tojo score as highly hawkish; Chamberlain, FDR, and Clinton score as dovish.
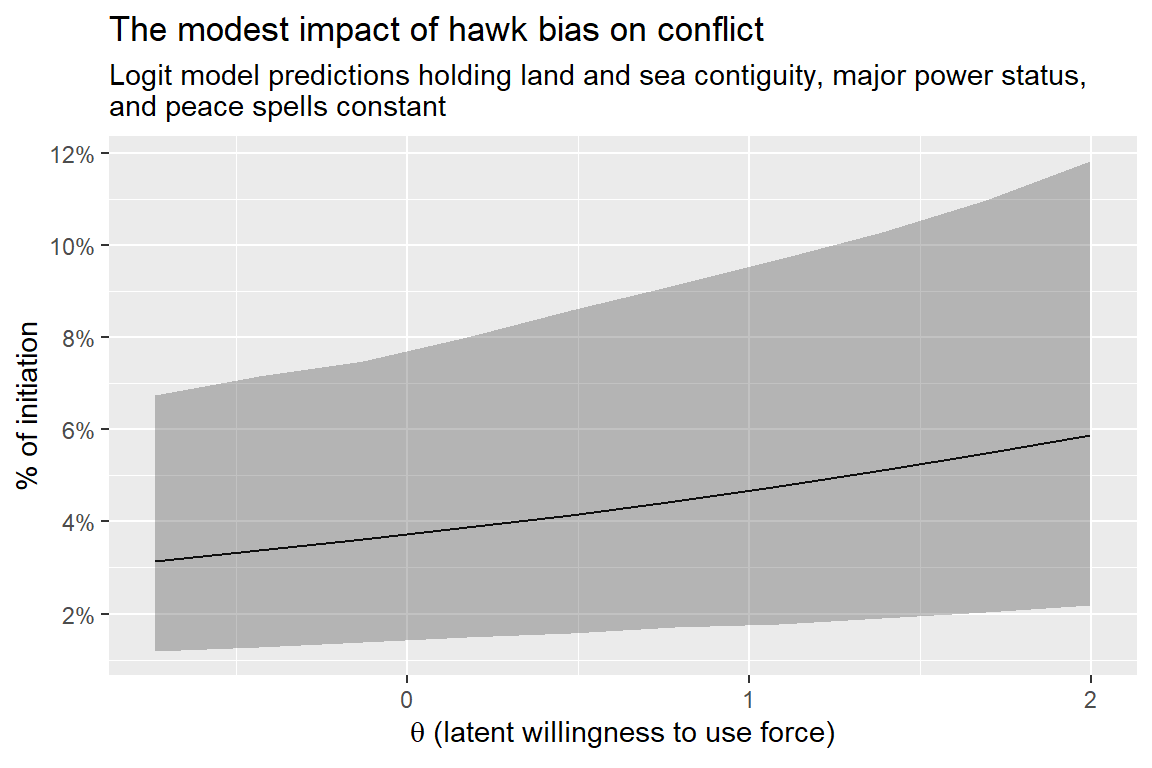
Hawkish leaders are statistically more likely to initiate international conflicts; moving from most dovish to most hawkish roughly doubles the probability of conflict initiation (~3% to ~6%).
Takeaway: Leader selection matters. Electing hawks increases the risk of war.
10.1 Do Leaders Matter?
All of the factors I covered in the previous chapters that might predict why countries are willing to go to war were a mix of structural and institutional explanations: the balance of power, democracy, trade, and alliances. How much influence do individual leaders have?
Some argue that leaders have a great deal of influence. Few would disagree about Adolf Hitler’s role in World War II, and Napoleon’s importance for the Napoleonic Wars is implied in their name. Any time countries choose to go to war, a political leader (a president, a prime minister, a king, a dictator) was involved in making the decision. The influence of leaders seems obvious.
Not everyone agrees. Braumoeller (2019) notes that the political conditions in Germany created by post-World War I reparations and the Great Depression created space for a hypernationalist, militaristic regime to form. Whether or not Hitler rose to power, plenty of others were waiting in the wings. Hitler’s role as leader may have been a sufficient condition for World War II, but Braumoeller (2019) believes it wasn’t necessary. You could make a similar argument for other leaders that took their countries to war, too.
These competing views boil down to whether you think leaders have agency or are captives of the moment. Do leaders shape world events, or do they merely react to their immediate circumstances?
For some time, the peace science community failed to provide a satisfying and comprehensive answer to this question. The problem lay in the fact that no large and representative datasets of political leaders across the world existed to test the impact of leaders in a systematic way.
This changed more than a decade ago. Thanks to comprehensive data collection efforts by Ellis, Horowitz, and Stam (2015) and Goemans, Gleditsch, and Chiozza (2009), researchers can now access vast repositories of data on leader backgrounds, political leanings, and psychological traits. Advancing the field even farther, Carter and Smith Jr (2020) recently devised a latent measure of leader hawkishness (or more precisely, leader willingness to use force) on the basis of the data generated by Ellis, Horowitz, and Stam (2015) and Goemans, Gleditsch, and Chiozza (2009) using Bayesian item response theory (IRT).
I want to focus on the concept of leader willingness to use force, which some also call hawkishness, in this chapter. The term “hawk” is a common term used in international relations to refer to someone with a hawk bias, which means they have a high predilection for aggressive action and war. You may have heard the term used in current events to describe the attitudes of certain US policymakers toward China. These individuals are often called “China hawks,” because they view China in adversarial terms and favor the US taking aggressive actions to compete with China, both economically and militarily. Those who disagree are sometimes called “doves,” which is the label used to describe those with a preference against use of force and other aggressive forms of foreign policy.
Hawk bias plays an important role in some theories of international conflict (Blattman 2023; Drezner 2022) that emphasize the importance of individual preferences and characteristics in explaining international politics. These theories often adopt the bargaining model of war, but they add a layer of complexity, allowing leaders to have their own unique bargaining range defined by their personal costs and benefits from going to war separate from a bargaining range for the rest of society. Hawkish leaders are argued to have a greater tolerance for the costs of war and/or greater anticipated benefits from going to war. The result is that hawks have narrower bargaining ranges, leaving less room, all else equal, for leaders to find a negotiated settlement preferable to war.
This argument seems sound, but without a direct measure of hawkishness, scholars made little progress on the influence of leader willingness to use force on conflict initiation. This is why the work by Carter and Smith Jr (2020) to develop a unified measure of leader willingness to use force is so consequential. For the first time, researchers could systematically test whether a leader’s general hawkishness predicts conflict initiation.
In the next section, I’ll describe this measure of hawkishness in greater detail. It has strengths and weaknesses that you need to be aware of. I’ll then walk through an example analysis to test whether hawkishness actually predicts conflict initiation.
10.2 Leader Willingness to Use Force
According to Carter and Smith Jr (2020), the literature explaining leader hawkishness tends to follow one of three paths. One centers on psychological characteristics. This body of work emphasizes leader dispositions, perceptions, and beliefs about the world.
Another focuses on political orientation. This work makes a strong (though empirically verified) assumption that right-leaning governments are more inclined to use military force. In the US context, this would imply that Republican presidents are coded as more hawkish than Democratic presidents, for example.
A third body of work emphasizes leader’s personal experience. Relevant factors include prior military service, education, career history, and so on.
Thanks to the hard work of many researchers, systematic data along all of these dimensions are now available for researchers to use. These are the very same sources that Carter and Smith Jr (2020) used to develop a single unified measure of willingness to use force.
How did they do this? I want to keep my summary as accessible as possible, so I won’t talk about the method Carter and Smith Jr (2020) used in detail. I do want to give you an intuitive sense for what they did.
There are many approaches that exist for collapsing multiple measures into one. The method Carter and Smith Jr (2020) used is called Bayesian item response theory (IRT). The goal is to estimate the level of a latent characteristic for individuals on the basis of observed characteristics. Latent factors are things that are unobservable, such as hawkishness. You can’t look at a leader to see whether they are hawkish. Hawkishness has to be inferred.
Because the approach is Bayesian, IRT involves starting with prior beliefs about the distribution of this latent characteristic and then updating those priors with data. In their case, Carter and Smith Jr (2020) use two priors. The first is that the latent measure they wish to capture is unit normal, which means it has a mean of 0 and most values fall between -1 and +1. For the second, they pick two leaders in the data to serve as examples they believe fall on opposite sides of the latent spectrum Carter and Smith want to measure. The leaders they picked were Hitler, to which they gave a score of +1 (meaning Hitler is a hawk), and the Dalai Lama, to which they gave a score of -1 (meaning the Dalai Lama is a dove). Every other leader starts out with a zero. Bayesian priors are then updated with observed characteristics to yield a final measure for each leader.
Carter and Smith Jr (2020) used a lot of variables on leaders to estimate their latent measure of willingness to use force. Below is a screenshot of Table 1 in their paper, which summarizes the variables they used.
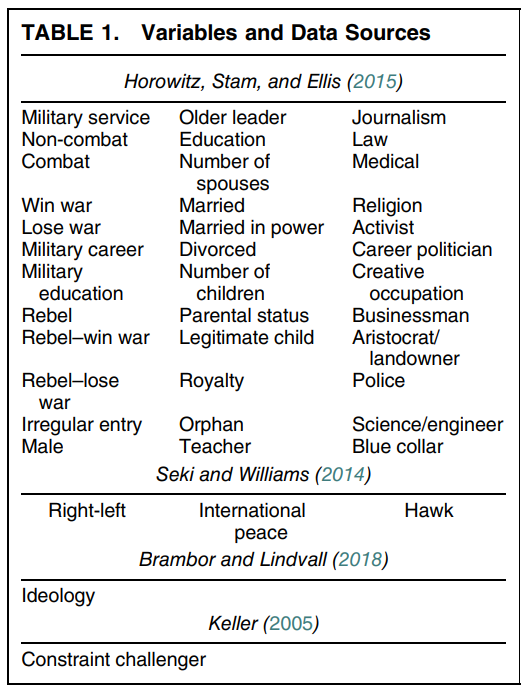
Carter and Smith Jr (2020) say that their measure should provide scholars with a unified way to test the systematic effect of leader hawkishness, but they caution against uncritical use. While the measure can be used to predict conflict onset, Carter and Smith Jr (2020) explicitly recommend against using their measure to predict the outcome of conflicts since they believe leader hawkishness will be subject to selection bias during a war. Countries may be more likely to put hawkish leaders in charge once a war has already started, making it hard to tell whether hawks cause certain conflict endings or are simply chosen during severe conflicts. Carter and Smith Jr (2020) also warn that their measure is an estimate, and that they measured each leader’s level of hawkishness with a certain degree of error. That means, for each leader in the dataset, there is a measure of hawkishness and a standard deviation for that unique measure.
The real test of a measure is whether it’s useful for predicting the thing it’s meant to capture. Limitations aside, this measure of willingness to use force should predict a higher likelihood that leaders initiate international conflicts. If it fails, this might raise questions about its validity. Carter and Smith Jr (2020) find that their measure performs well at predicting conflict, so it should be no trouble to replicate that result, as I attempt to do in the next section.
10.3 Testing the Impact of Leaders
Studying the role of leaders in conflict is not the focus of mainstream peace science. Therefore, I’m not aware of a clear standard for how to construct a dataset and analyze it. In the analysis that follows I draw on some active research I’m doing on leaders and war, which I recently presented at the 2026 meeting of the International Studies Association (a major scholarly conference for international relations researchers). My study is about the moderating effect political institutions have on hawkish leaders.
My research design is much different from the standard dyad-year dataset used in peace science. Instead, I use a leader-year dataset where each unit of observation is a unique country leader in a specific year. This kind of dataset is sometimes called “monadic.” Unlike a dyadic dataset, which tracks pairs of countries, a monadic dataset tracks one country or leader at a time. I believe this is the most appropriate level of analysis for testing the effect of leader hawkishness because the goal is to test the effect of a possible initiator’s characteristic on conflict onset. The relationship between the initiator and a potential target isn’t theoretically relevant. I want to test whether a leader initiates any international conflict regardless of the characteristics of the target.
This doesn’t mean I can ignore opportunities to fight. In my dataset I include measures of the number of land and sea borders a country shares with other countries, and an indicator of major power status. I also include a measure of the number of years since a leader’s country initiated at least one international conflict (that is, peace spells).
Constructing this data requires some less-than-straightforward code, which you can see below. This is borrowed directly from my research on hawkish leaders. I excluded certain bits of code that are irrelevant for the present example. The reason the code is so much more complex is that I need to ensure that conflict initiations are attributed to the correct leader of a country. This becomes most relevant during transition years when at least two leaders hold office. To get conflict initiation correctly attributed to leaders, I start by creating a leader-day dataset with {peacesciencer}, which I then cross-reference with the raw MIE dataset (Gibler and Miller 2024) which includes day-level detail about when conflicts were started, and by which country. If the date falls within the tenure of leader A in a given year, it counts as that leader’s initiation. If the date falls within the tenure of leader B later that year, it counts as that leader’s initiation. The rest of the code aggregates the data up to the leader-year, after leaders and conflicts are matched, and then adds information about leader willingness to use force from Carter and Smith Jr (2020), and the relevant control variables. The {peacesciencer} package provides direct access to this data with the function add_lwuf(), which will add Carter and Smith’s measure to a leader-year dataset.
Before jumping into the analysis, I think it’s a good idea to take a look at the data. You’ll notice there are eight columns in the dataset I made above that begin with theta. These stand for the latent parameter \(\theta\) that Carter and Smith Jr (2020) use to represent willingness to use force. There are eight columns because there are four different measures of willingness to use force that Carter and Smith created, and each has an estimate of uncertainty associated with it. The measure that they recommend using is \(\theta_2\), which is the theta2_mean column in the data. This measure was the best-performing of the four in Carter and Smith’s analysis, and it captures the three main dimensions Carter and Smith argue are used to explain hawkishness: psychological characteristics, political orientation, and background experiences. The other measures are estimated using slightly different combinations of factors. Therefore, I’ll use theta2_mean in my analysis here.
The figure below shows the distribution of this measure of willingness to use force. The estimated latent variable \(\theta_2\) is continuous and real-valued. By construction, values less than 0 indicate that a leader is estimated to be more dovish (the opposite of a hawk), and values greater than 0 indicate a leader is more hawkish (willing to use force). You can see that a plurality of leaders cluster on the dovish end of the spectrum around -0.5, but many leaders show some positive level of hawkishness (42.2% to be exact). The distribution is also skewed. The most hawkish leader is more willing to use force than the most dovish leader is unwilling to use force. The highest score in the data is nearly +2, which belongs to Georgios Kondilis (sometimes spelled Kondylis) of Greece. The lowest score is -0.74, which belongs to Bill Clinton.
ggplot(dt) +
  aes(theta2_mean) +
  geom_density(fill = "steelblue") +
  labs(
    title = "How common is hawk bias?",
    subtitle = "Distribution of leader willingness to use force",
    x = expression(theta*" (latent willingness to use force)"),
    y = NULL
  )
Warning: Removed 269 rows containing non-finite outside the scale range
(`stat_density()`).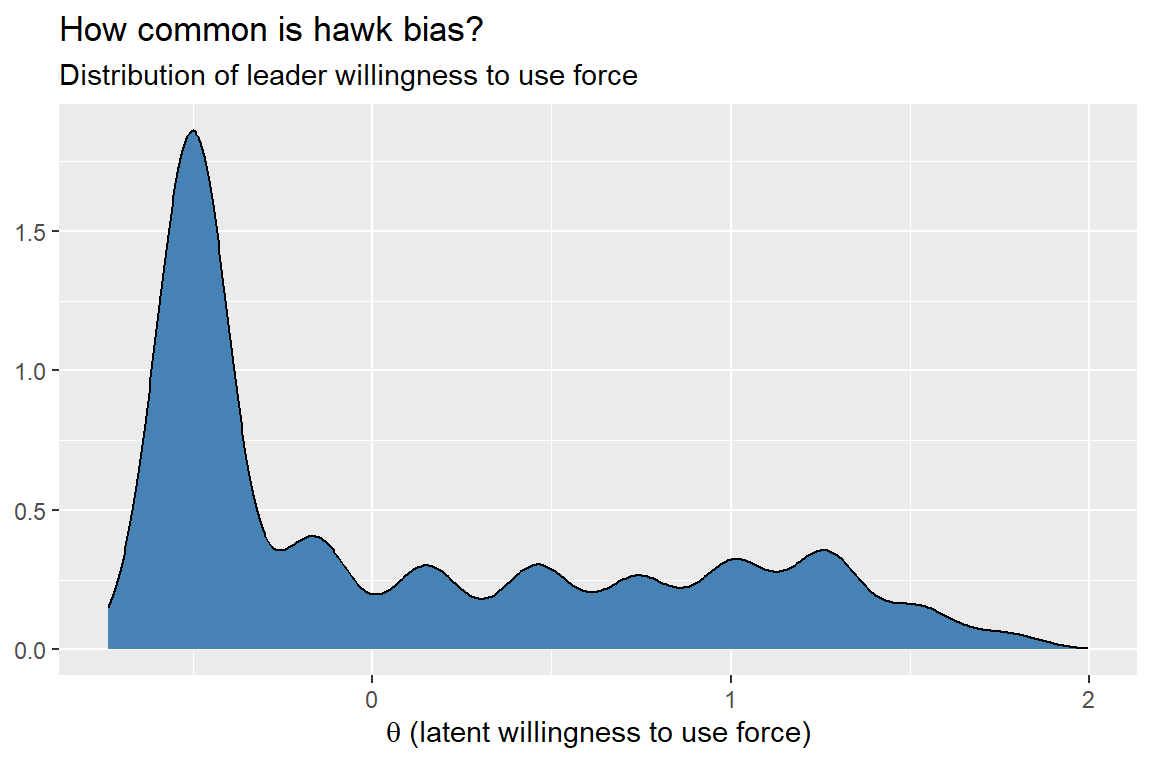
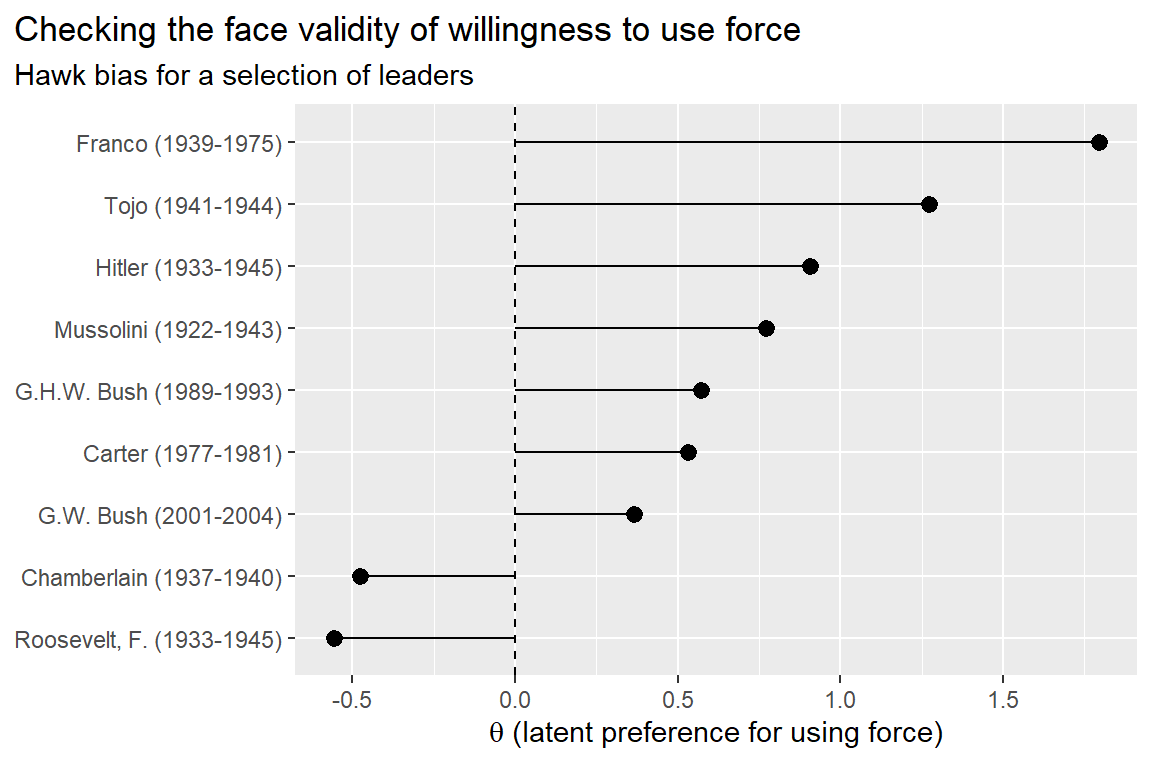
The next figure shows willingness to use force for a selection of various leaders in the data. It’s interesting to take a look at how the numbers break down, and it’s important to check whether \(\theta_2\)’s values are sensible. I think they are. Important figures from World War II, such as Spain’s Franco, Germany’s Hitler, Italy’s Mussolini, and Japan’s Tojo are all on the high end of hawkishness. Conversely, look at Britain’s Chamberlain, well-known for his ineffective appeasement policies toward Germany in the lead up to World War II. His score is nearly -0.5. US President Roosevelt (FDR) is actually slightly more dovish than Chamberlain. I included some other US presidents as well. Both Bushes are estimated to be on the hawkish end of the spectrum, and so is Carter.
dt |>
  mutate( # note that Chamberlain is misspelled in the data
    leader = ifelse(
      leader == "Chamberlin",
      "Chamberlain", leader
    )
  ) |>
  group_by(leader) |>
  mutate(
    leaderyear = paste0(
      leader, " (", min(year), "-", max(year), ")"
    )
  ) |>
  ungroup() |>
  distinct(leader, leaderyear, theta2_mean) |>
  filter(
   leader %in% c("Hitler", "G.W. Bush", "G.H.W. Bush",
                 "Franco", "Mussolini", "Carter",
                 "Chamberlain",
                 "Tojo", "Roosevelt, F.", "Dalai Lama")
  ) |>
  ggplot() +
  aes(
    x = theta2_mean,
    y = reorder(leaderyear, theta2_mean)
  ) +
  geom_pointrange(
    aes(xmin = 0, xmax = theta2_mean)
  ) +
  geom_vline(
    xintercept = 0,
    lty = 2
  ) +
  labs(
    title = "Checking the face validity of willingness to use force",
    subtitle = "Hawk bias for a selection of leaders",
    x = expression(theta*" (latent preference for using force)"),
    y = NULL
  ) +
  theme(
    plot.title.position = "plot"
  )
Does willingness to use force predict international conflict? The below code estimates a simple logit regression model to see. Because the unit of analysis is an individual leader in a given year, the model specification is different from what I did in prior chapters. The outcome is an indicator of whether a leader initiated an international conflict with at least one other country in a given year. The main predictor is theta2_mean (willingness to use force). To adjust for opportunities to initiate conflicts, I include the measures land and sea, which capture the number of countries that share contiguous land and sea borders with a leader’s country. I also include a measure for whether a leader’s country is a major power. Finally, to adjust for dependence in conflict initiation over time, I include a cubic peace spell trend. I also use robust standard errors clustered by country.
glm_robust(
  miconset_init ~ theta2_mean + land + sea + cowmaj +
    micspell + I(micspell^2) + I(micspell^3),
  data = dt,
  clusters = "ccode"
) -> fit
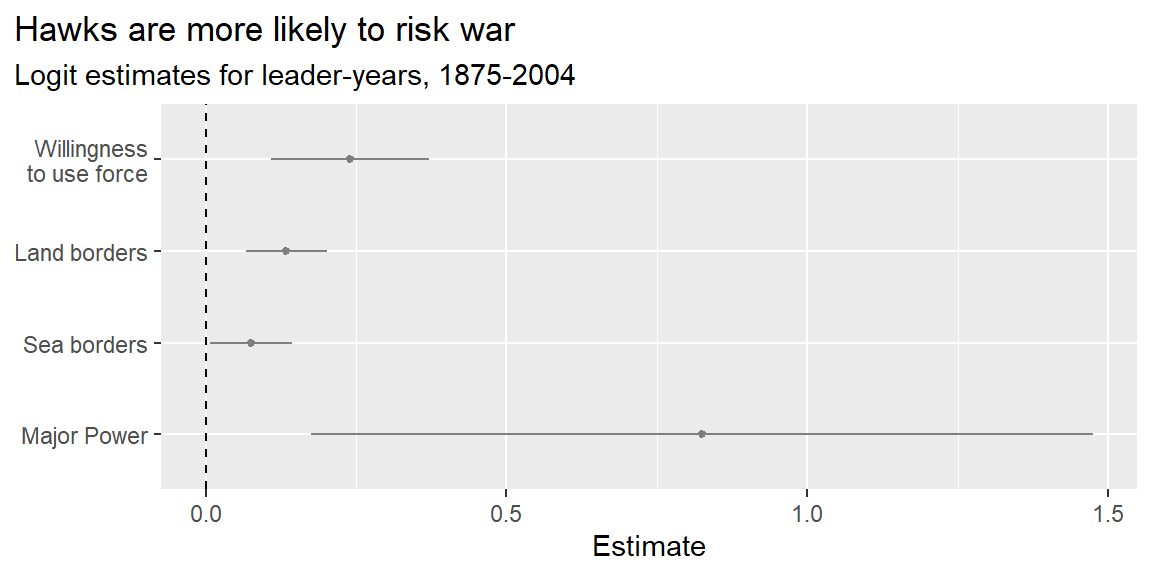
What’s the verdict? Are hawkish leaders more likely to initiate international conflicts? The answer is “yes,” which you can see in the coefficient plot below. Beyond the fact that more opportunities for conflict (more land and sea borders with other countries), and ability to initiate conflicts at a distance (major power status), predict a greater chance that leaders initiate conflicts, leader willingness to use force predicts an increased chance of conflict initiation, too.
fit |>
  slice(2:5) |>
  coef_plot(
    coef_map = c(
      "Willingness\nto use force",
      "Land borders",
      "Sea borders",
      "Major Power"
    )
  ) +
  labs(
    title = "Hawks are more likely to risk war",
    subtitle = "Logit estimates for leader-years, 1875-2004"
  )
The next plot shows what this means in practical terms. Holding land and sea borders, major power status, and peace spells constant at their mean, the below figure shows the predicted chance that a leader initiates at least one conflict with another country in a given year. The estimate is a bit noisy, which means leader hawkishness doesn’t always perfectly explain why some countries are more likely to risk going to war than others but the predicted difference is meaningful. Going from a strong dove to a strong hawk predicts a doubling in the chance that a leader initiates an international conflict—specifically, a 3% chance compared with a 6% chance.
fit |>
  sim_pred(
    tibble(
      theta2_mean = seq(
        min(dt$theta2_mean, na.rm = T),
        max(dt$theta2_mean, na.rm = T),
        len = 10
      ),
      land = mean(dt$land, na.rm = T),
      sea = mean(dt$sea, na.rm = T),
      cowmaj = mean(dt$cowmaj, na.rm = T),
      micspell = mean(dt$micspell)
    )
  ) -> pred

pred |>
  group_by(theta2_mean) |>
  summarize(
    est = mean(p),
    lo  = quantile(p, 0.025),
    hi  = quantile(p, 0.975)
  ) |>
  ggplot() +
  aes(theta2_mean, est, ymin = lo, ymax = hi) +
  geom_line() +
  geom_ribbon(
    alpha = .3
  ) +
  scale_y_continuous(
    labels = scales::percent,
    breaks = seq(0, 1, by = 0.02)
  ) +
  labs(
    title = "The modest impact of hawk bias on conflict",
    subtitle = "Logit model predictions holding land and sea contiguity, major power status,\nand peace spells constant",
    x = expression(theta*" (latent willingness to use force)"),
    y = "% of initiation"
  )
This analysis certainly doesn’t prove that leaders matter for war, but it’s consistent with the idea. Perhaps leaders aren’t just captives of the moment, reacting to events with little to no real agency. Maybe who your leader is can really influence whether you go to war.
10.4 Summary
The question of whether leaders matter for war is an old one, but not until recently has it been feasible to test this idea in a systematic way. Thanks to work by Ellis, Horowitz, and Stam (2015); Goemans, Gleditsch, and Chiozza (2009); and Carter and Smith Jr (2020), relevant data exists, and the results show that leaders do matter.
My own analysis in this chapter supports this argument. Using the measure of leader willingness to use force created by Carter and Smith Jr (2020), I find that hawkish leaders are more likely to initiate at least one international conflict with another country than dovish leaders. The most extreme hawk is twice as likely to initiate a conflict than the most extreme dove.
For anyone interested in studying international conflict, work on the role of leaders is an exciting area of study that isn’t as well explored as other issues. It also is deeply relevant. In democracies in particular, choosing leaders is a regular occurrence. If you want to minimize the chance of war, this research shows that electing hawks is a bad idea.