## open {tidyverse} and {peacesciencer}
library(tidyverse)
library(peacesciencer)

## make a leader-year base dataset
create_leaderyears(
  standardize = "cow",
  subset_years = 1875:2004
) |>
  ## add conflict data
  add_gml_mids() |>
  add_spells() |>
  ## add leader data
  add_lwuf() |>
  ## add democracy data
add_democracy() -> Data8 Unchecked Interests
As Blattman (2023) discusses in Why We Fight, unchecked interests are one of several reasons for war. Unchecked interests come into play when a leader’s incentives differ from their group’s. Depending on the kind of governance model in a given country, organization, or gang, the leader or chief executive can either face many or few checks and balances on their power. In a democracy like the United States, the chief executive is the President. While he has a significant degree of latitude, he also cannot do whatever he wishes. Not only does he have to contend with two other branches of government (Congress and the Courts), he also is elected by the American states every four years and can only serve as President for two terms. If he wants to stay in power for those two terms, the President is forced to consider the preferences of the average American citizen. His ability to act is further constrained by the other branches of government.
By contrast, in a dictatorship or autocracy the chief executive has few or no checks on his power. In Russia, Vladimir Putin, while not all powerful, has the latitude to do quite a lot more than the US President, including starting a war with Ukraine. By most all metrics, Russia as spent a great deal of blood and treasure as a result of its invasion and attempted occupation of Ukraine and gained little in return. Few would argue that the average Russian citizen is better off because of the war. Much to the contrary, things are worse. Putin, however, does not face the same costs for going to war with Ukraine as the citizens of his country. In fact, many leaders of autocratic countries can enjoy net benefits from going to war even while the broader public suffers. Since there is little in the way of checks and balances on their power, not much stands in their way or forces them to consider the broader societal cost of choosing to fight over finding a peaceful settlement.
As mentioned in the previous chapter, few checks on leader interests can lead to a breakdown in the logic of the traditional bargaining model of war (Fearon 1995). The bargaining model begins with the assumption that war is costly and victory in war isn’t guaranteed. It further assumes that decision makers are rational—having well-defined preferences and behaving in ways consistent with maximizing those preferences. Within the bargaining model framework, the cost of war and uncertainty about outcomes creates a bargaining range, which is a set of compromise distributions of some prize over which two sides of a dispute wish to have. Any value in this range would given both sides a payoff greater than what they could expect to get from going to war. Therefore, there is no reason to expect that rational decision-makers would choose to fight. Their incentive is to find a peaceful settlement.
However, like in the case of Russia, it is possible that a leader will face few to no personal costs from going to war. They might also receive some bonus from choosing to fight, like a greater likelihood of holding on to power or personal enrichment from the spoils of war. If this is the case, the bargaining model no longer applies.
The story of unchecked interests as a cause of war seems logically sound, but that does not guarantee that it will hold up under the light of empirical investigation. The goal of this chapter is to demonstrate how we can use data to test whether checks on leader interests really help explain patterns in peace versus war.
8.1 Looking at Leaders and Measuring Checks on Interests
From a data perspective, the {peacesciencer} package has us covered. We can use it to study checks on leader interests by first creating a base dataset at the level of leader-years. We can then populate the data with variables that capture two factors of interest: (1) level of leader interest in using force and (2) checks and balances on leader interests.
For the first factor, we’ll rely on the “Leader Willingness to Use Force” metric developed by Carter and Smith (2020). Without going into too much technical detail, Cater and Smith use a Bayesian approach that relies on leader-specific data created by Ellis, Horowitz, and Stam (2015) to generate a single measure that quantifies willingness to use force for all heads of state from 1875 to 2004 . It isn’t a perfect measure, but it’s a good bet that it’s correlated with how much a leader might benefit from going to war.
For the second factor, we’ll rely on several common measures of democracy. While democracy does not guarantee that a leader is fully constrained from going to war if doing so would be personally beneficial, it does suggest they have limited capacity to do so. If leaders of democracies want to stay in power, they would want to avoid taking actions that on net harm their citizens. The {peacesciencer} package gives us access to three measures of democracy: Polity, V-Dem, and an extended version of UDS. Each has its own strengths and weaknesses, both in terms of capturing what we’re most interested in (checks on leaders) and in terms of quantifying democratic governance more generally.
The Polity project has been in existence for decades and represents one of the first attempts to quantify quality of democracy for the countries of the world (Marshall, Gurr, and Jaggers 2017). It emphasizes constraints on leaders, placing countries in a given year on a 21 point scale from -10 to 10 (-10 being an established autocracy and 10 an established democracy) on the basis of:
Competitiveness of executive recruitment
Openness of executive recruitment
Constraints on the executive
Competitiveness of political participation
Regulation of political participation
In terms of helping us quantify checks on leader interests, Polity has some advantages, because it explicitly takes into consideration checks and balances on a country’s chief executive.
The Varieties of Democracy (V-Dem) project takes a different approach to quantifying democracy (Coppedge et al. 2020). It emphasizes factors like free and fair elections and free and independent media. As a measure of democracy, this is conceptually closer to the mark than Polity. At the same time, it may fail to adequately pick up on checks on leaders.
The final measure, UDS or United Democracy Scores (Pemstein, Meserve, and Melton 2010), is based on an extended version of UDS developed by Marquez (2016). The UDS approach relies on a latent variable approach to combine many different measures of democracy into one. Essentially, it’s a compromise measure. For example, it incorporates information from Polity, but it also relies on V-Dem (among other measures of democracy). Because it relies on many measures, it provides some of the best coverage among democracy measures. It also (theoretically) does a good job of blending the kinds of executive constraints emphasized by Polity with the other kinds of electoral constraints and features of democracy emphasized by V-Dem.
8.2 What Should We See in the Data?
Before we get to the data analysis, we should first propose a hypothesis for what we expect to see in the data if unchecked interests are a reason for war. A reasonable expectation would be the following:
Hypothesis: Leader willingness to use force should predict a greater likelihood that a country starts a fight with another country when quality of democracy is low, and it should have minimal impact on the likelihood that a country starts a fight with another country otherwise.
The intuition behind this expectation is simple—if a leader is willing to use force, they’re most likely to actually use force if they face few bearers to action.
8.3 A Leader-Year Analysis
To test our hypothesis, we’ll put together leader-year dataset using {peacesciencer} and then populate it with the relevant variables for our analysis. To measure conflict, we’ll use militarized interstate dispute (MID) initiation as measured by Gibler, Miller, and Little (2016). This can be added using the add_gml_mids() function after creating the base data using create_leaderyears(). We’ll then incorporate leader willingness to use force using add_lwuf() and democracy measures using add_democracy(). Here’s the specific code we’ll use:
The next thing we’ll do is put together a simple statistical model of the likelihood that a leader initiates a MID against another country. Since a leader either does or doesn’t initiate a conflict, we’re dealing with a binary outcome. A nice way to model this is using a logit regression model with the probability of MID initiation by a leader \(l\) in year \(t\) specified as:
\[ \Pr(\text{MIDinit}_{lt} = 1) = g(\beta_0 + \beta_1 \text{LWUF}_{lt} + \beta_2 \text{Dem}_{lt} + \beta_3 \text{LWUF}_{lt} \times \text{Dem}_{lt} + s_{lt} + s_{lt}^2 + s_{lt}^3) \]
Because our hypothesis specifies that leader willingness to use force will only have an effect on the likelihood of MID initiation for lower levels of democracy, we have a conditional hypothesis. To appropriately test it, we need to specify a statistical model that includes an interaction term between leader willingness to use force and democracy. If you look at the specification above, you can see that an interaction has been included in the model. The model also includes a cubic peace spells trend to adjust for the fact that peace is sticky. We need to account for this in the model to ensure our estimates are unbiased and efficient.
The below code estimates logit models as specified above using each of the alternative measures of democracy.
## models of leader willingness to use force
  # using polity2 to measure checks on leaders
polity_model <- glm(
  gmlmidonset_init ~ theta2_mean * polity2 +
    poly(gmlmidinitspell, 3),
  data = Data,
  family = binomial
)

  # using v2x_polyarchy (V-Dem) to measure checks
vdem_model <- glm(
  gmlmidonset_init ~ theta2_mean * v2x_polyarchy +
    poly(gmlmidinitspell, 3),
  data = Data,
  family = binomial
)

  # using xm_qudsest (UDS) to measure checks
uds_model <- glm(
  gmlmidonset_init ~ theta2_mean * xm_qudsest +
    poly(gmlmidinitspell, 3),
  data = Data,
  family = binomial
)
Now that our models are fit, we need to look at their output to see if the results are consistent with our hypothesis. Since we’re dealing with an interaction effect, visualizing the output is far more intuitive than looking at something like a regression table. To do this, we’ll use the plot_model() function from {sjPlot}. The below code opens the package. If you need to install it, all you need to do is write install.packages("sjPlot") in the R console.
## open {sjPlot} to plot predictions
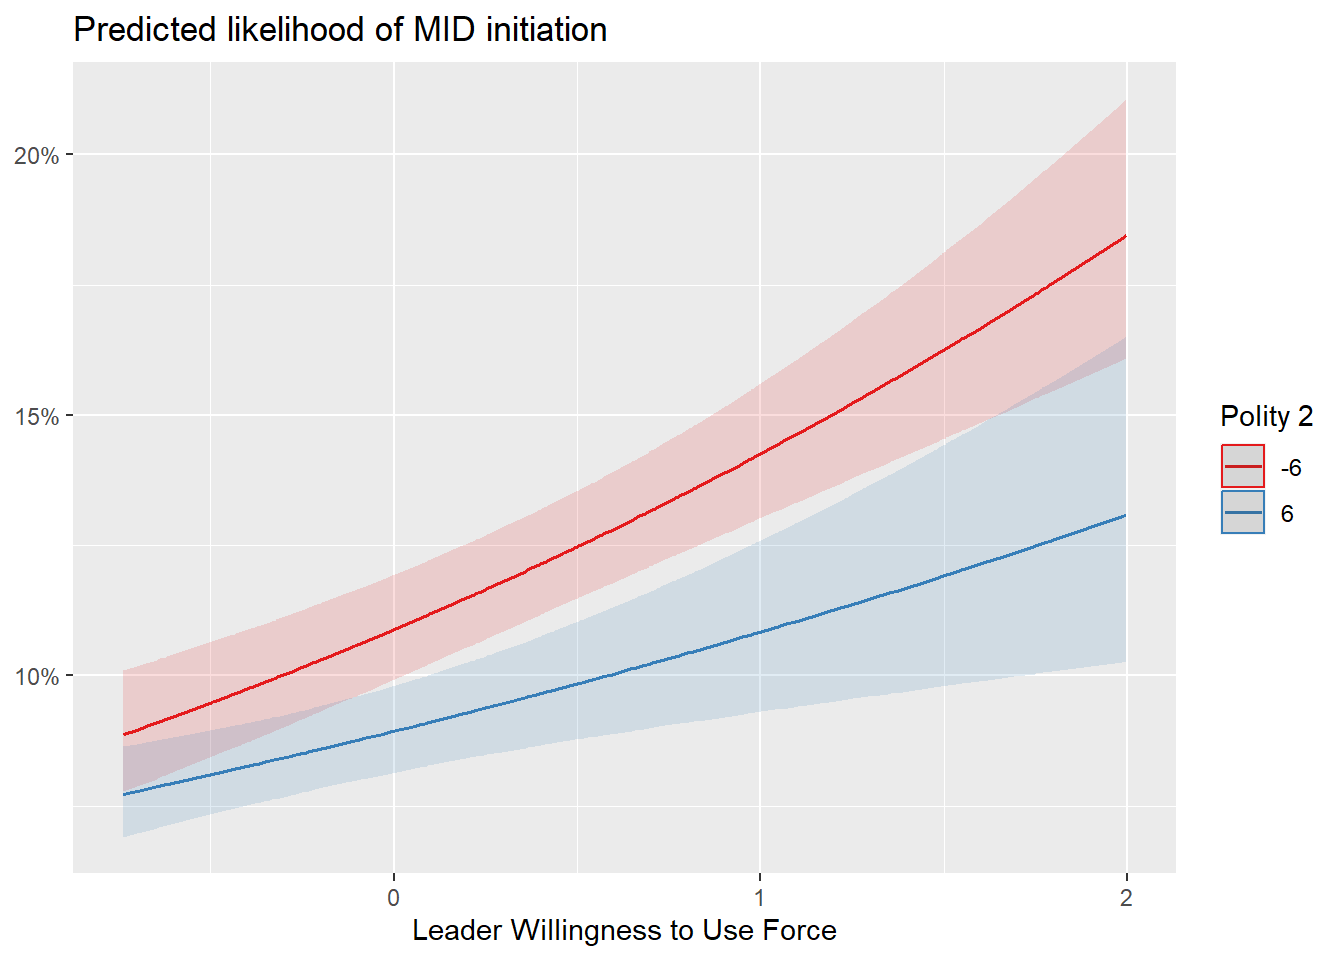
library(sjPlot)The below figure summarizes the results with Polity as our measure of democracy. It shows on the x-axis different values of leader willingness to use force from lower to higher levels. On the y-axis is shows the estimated percent likelihood that a leader starts a MID with another country. The different colored lines show how this likelihood given leader willingness to use force changes depending on two different levels of the Polity measure. To show reasonable contrast, it shows what this relationship looks like if Polity is -6 or +6. Sure enough, the results support the hypothesis. Leader willingness to use force predicts a higher likelihood of MID initiation for countries with lower Polity scores. For countries with higher Polity scores, the relationship is still positive, but attenuated in magnitude.
## show how leader willingness to use force
## predicts likelihood of MID initiation
## depending on polity:
plot_model(
  polity_model,
  type = "pred",
  terms = c("theta2_mean", "polity2 [-6, 6]")
) +
  labs(
    x = "Leader Willingness to Use Force",
    y = NULL,
    title = "Predicted likelihood of MID initiation",
    color = "Polity 2"
  )
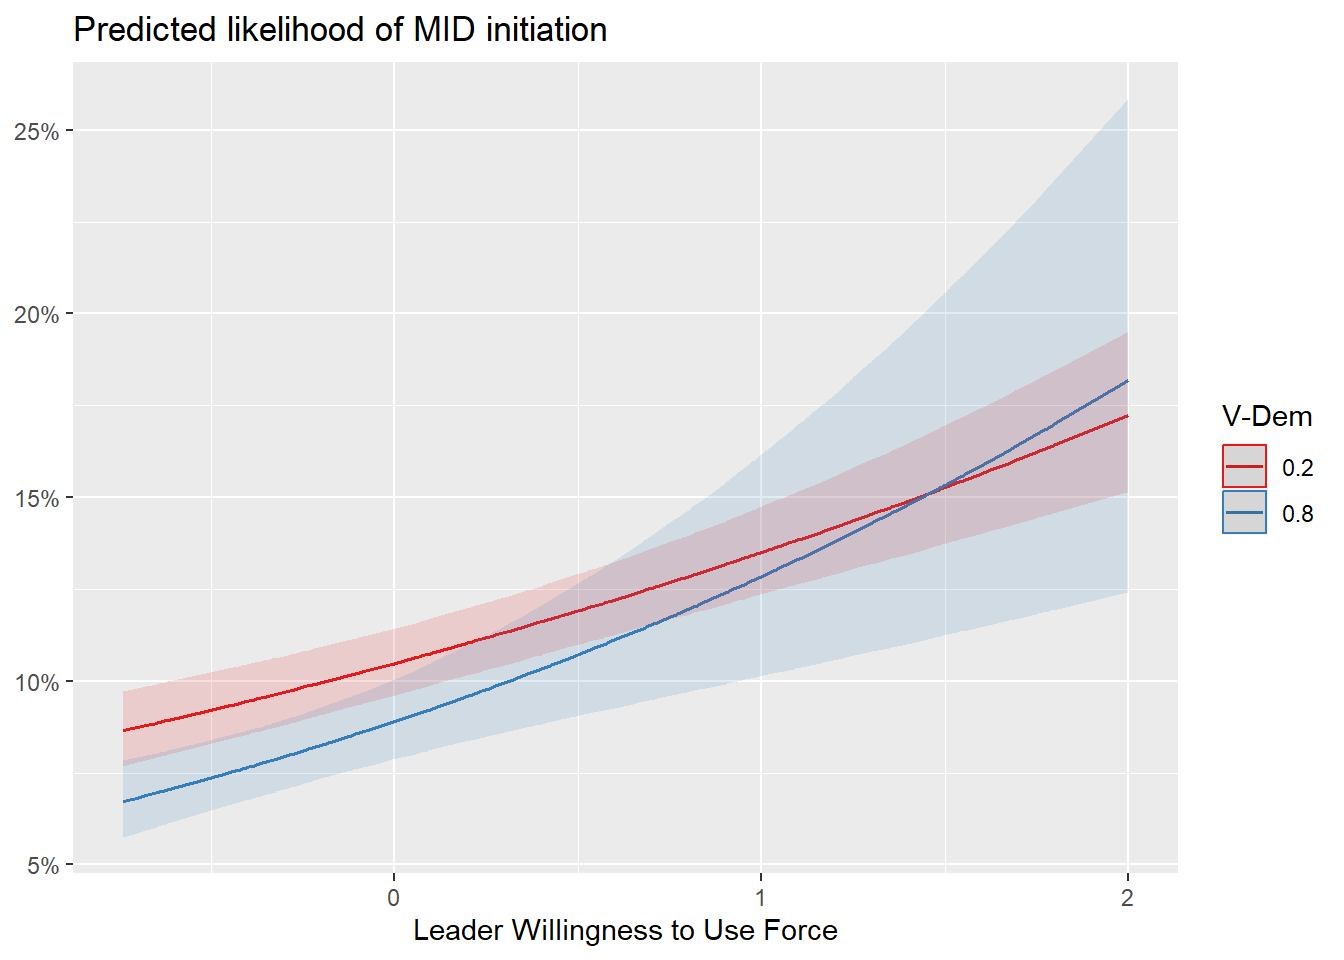
The next figure shows the same information, but with the V-Dem measure of democracy. Interestingly, our hypothesis is not supporting using V-Dem. One reason could be, as discussed earlier, V-Dem does not emphasize executive constraints to the extent that Polity does.
## show how leader willingness to use force
## predicts likelihood of MID initiation
## depending on V-Dem:
plot_model(
  vdem_model,
  type = "pred",
  terms = c("theta2_mean", "v2x_polyarchy [0.2, 0.8]")
) +
  labs(
    x = "Leader Willingness to Use Force",
    y = NULL,
    title = "Predicted likelihood of MID initiation",
    color = "V-Dem"
  )
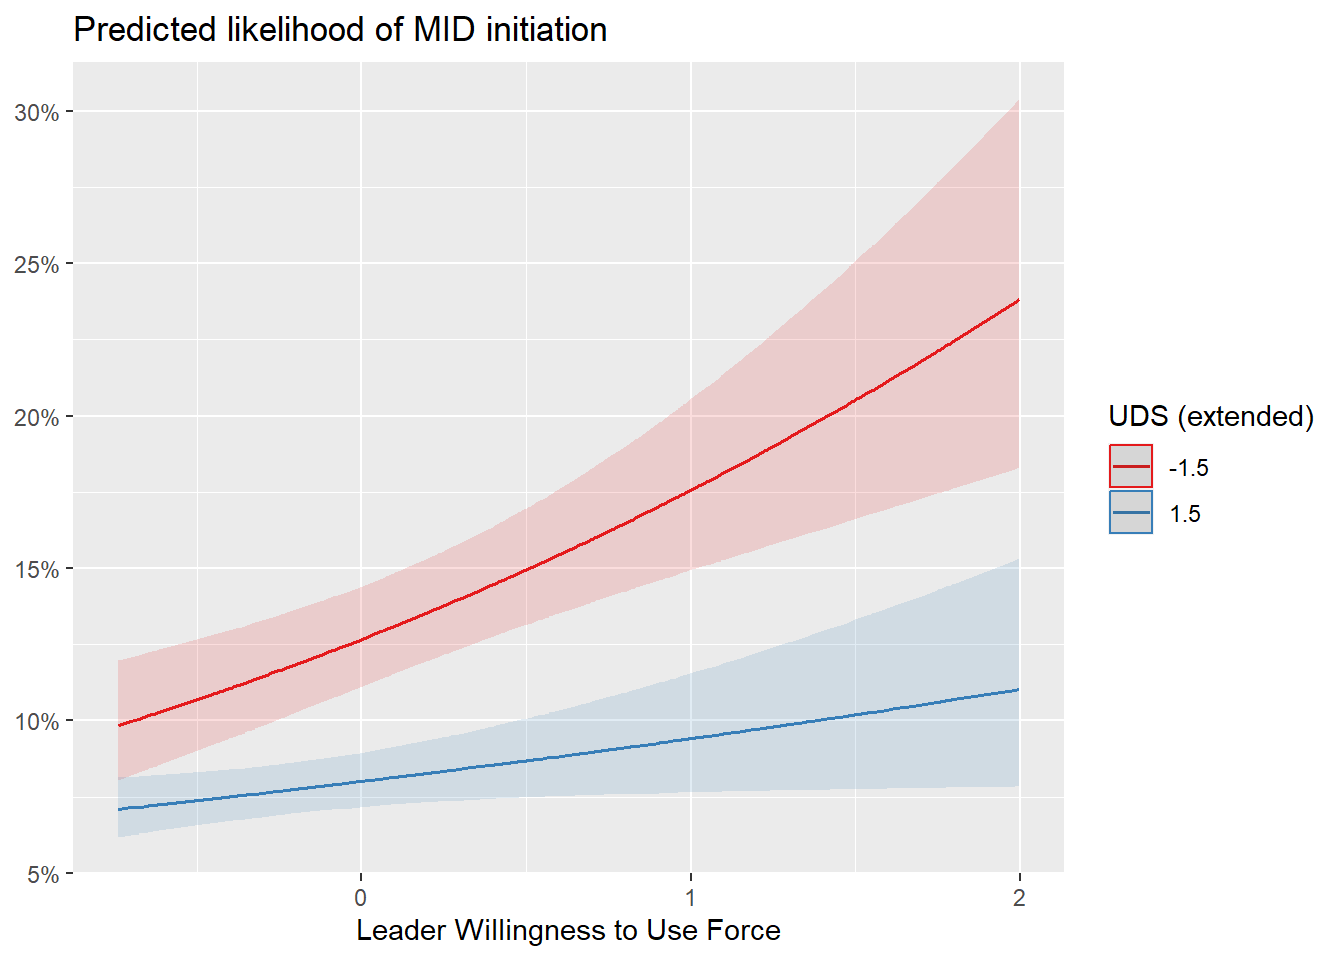
The final figure shows the same information, but with the UDS measure of democracy. Here, the results again support the hypothesis. Since UDS incorporates information from Polity, it makes sense that the results are more in line with the first model.
## show how leader willingness to use force
## predicts likelihood of MID initiation
## depending on UDS:
plot_model(
  uds_model,
  type = "pred",
  terms = c("theta2_mean", "xm_qudsest [-1.5, 1.5]")
) +
  labs(
    x = "Leader Willingness to Use Force",
    y = NULL,
    title = "Predicted likelihood of MID initiation",
    color = "UDS (extended)"
  )
8.4 Wrapping up
The idea that unchecked interests are an important reason for war is logically sound, and if we were to look at a number of specific cases, as Blattman (2023) does in Why We Fight, we would see the role played by unchecked interests in action. But specific cases can be misleading. In this chapter, we showed that you can also use data to assess the role of unchecked interests as a reason for war in a more systematic way.
Of course, the task of doing so comes with some necessary judgment calls. The most important of these was how to measure checks on leader interests. Democracy seems like a reasonable proxy for this concept, but there are many possible measures to choose from. Each one of these measures emphasizes some different factors in quantifying democracy. In turn, different measures either support or fail to support unchecked interests as a reason for war.
This analysis barely scratches the surface, and its results should not be taken as a definitive statement on the role of unchecked interests as a cause for war. That wasn’t the goal of this chapter to begin with. But as a demonstration of how we can use data to study claims about conflict, this analysis provides a good place to start for anyone interested in improving and expanding on it.