source("http://tinyurl.com/aiddatadownloads")16 Interventions
The final set of factors that Blattman (2023) argues provide a pathway to peace is interventions. This pathway to peace consists of a cluster of ways that third-parties can intervene in disputes to maintain the peace or bring a speedy end to an ongoing conflict. Blattman discusses five specific kinds of interventions:
- Punishing (a good example is economic sanctioning)
- Enforcing (a good example is the presence of armed UN peacekeepers)
- Facilitating (a good example is third-party mediation)
- Socializing (a good example is a program of rehabilitation for former rebels or criminal gang foot soldiers)
- Incentivizing (a good example is foreign or military aid)
Reams of studies have been conducted that look at each of these interventions. According to Blattman (2023), their overall track-record is haphazard, but there are reasons to be cautiously optimistic. When objectives are modest and third-parties are committed to making slow progress over the long-haul, interventions are an effective pathway to peace.
When it comes to studying interventions with data, we have quite the buffet of options before us. To narrow the scope of the analysis, let’s focus on the last of the interventions listed above: incentives. In particular, let’s look at foreign aid from a powerful hegemonic power—the United States.
16.1 Hypotheses
It’s probably a good idea to first define some terms related to foreign aid. To begin with, what is foreign aid? When we talk about foreign aid, a good working definition is that it is official development assistance given from one country government to either another country government or non-government actors in another country for the purposes of promoting economic development or addressing humanitarian needs. To receive foreign aid, a country must meet specific criteria, such as being recognized as a low- or middle-income country (LIC or MIC). This label is determined by an inflation-adjusted threshold for GDP per capita that is regularly defined by organizations like the World Bank and the Organization for Economic Cooperation and Development. While most countries that give foreign aid are high-income, industrialized countries, the past few decades have seen a trend where many countries receiving aid are now instituting their own foreign aid programs. China is an especially important actor on this front.
While the stated purpose of aid is to promote economic development and address humanitarian disasters, the decisions behind its allocation—whom to give aid to and how much to give—are heavily influence by politics. A recent study by Dreher, Lang, and Reinsberg (2024) reveiws a large body of research on foreign aid allocation. Their survey of the literature shows that the countries that give foreign aid (we call these donors) have an interest in responding to the needs of the countries getting this aid (we call these recipients). However, other factors, like promoting trade and exercising political influence are a main driver of donor giving as well.
Among the diverse goals of donors is peace. Many studies show that donors base their aid giving on whether a country is experiencing a civil war (or its neighbor is experiencing a civil war). Though, as Dreher, Lang, and Reinsberg (2024) find in their review of the aid literature, some studies show that some donors seem to stay clear of civil war, while other studies that control for different factors fail to find evidence that donors really do target aid on the basis of civil war.
Though evidence that donors really care about civil war in their aid allocation decisions is mixed, there is a sizable body of evidence that aid helps to promote peace in aid recipients. Even more, research shows that when aid receipts are highly volatile from one year to the next, this can actually have destabilizing effects.
One thing that’s odd about the aid literature when it comes to conflict is that nearly all the evidence that aid promotes peace is based on studying civil wars. In the review done by Dreher, Lang, and Reinsberg (2024), I couldn’t find a single study that looks at the link between aid and international conflict. A search on Google Scholar also came up empty.
I’m not surprised. People who study issues in international political economy (like foreign aid) often don’t engage much with issues in security studies. Civil war is probably the one major point of overlap in these areas of research, but international conflict stills seems to be siloed from the foreign aid literature.
Let’s be brave and start to chip away at this division of labor. There’s reason to expect a relationship between foreign aid and international conflict. As a foreign policy tool, aid is often an effective way for a donor to buy policy favors from a recipient. If countries, especially powerful hegemons like the United States, have an interest in promoting international peace, it’s plausible that they use foreign aid as an incentive to keep countries from starting fights with other countries in the international system.
Let’s put this idea to the test. If the U.S. does have an interesting in promoting peace, then countries that receive more aid from the U.S. should be less prone to starting militarized interstate disputes (MIDs):
Hypothesis: The more aid a country receives from the U.S., the lower its probability of MID initiation.
Let’s put together some data to help us test this hypothesis.
16.2 Data
There are two major sources of foreign aid data that aid scholars use in their research. One is the OECD. The other is the AidData Research Lab at the College of William and Mary. Because I use aid data for most of my research, I’ve put together some tools that make the process of reading aid data into R much easier. I’m still working on refining these tools. At the moment I can only use them to read in AidData’s version of the data which only goes up to 2013. The OECD’s coverage is as recent as last year, so one of my goals is to incorporate this data into my set of tools as well. In the future, I’ll also probably make an R package like {peacesciencer} that will make it possible for anyone to easily work with this data for their research. For now, what I have are a bunch of helper R functions that exist in a source file on my GitHub. I’ve saved these in a GitHub repository that I’ve called aiddata_database (url here: https://github.com/milesdwilliams15/aiddata_database).
Rather than install an R package, to use the functions I’ve created to read in foreign aid data, you just need to run the following source code in R:
The work-horse function that I’ve created for accessing the data is called get_aiddata().
The below code shows how to incorporate this into a {peacesciencer} workflow. It starts by opening the {tidyverse} and {peacesciencer}. It then creates a country-year base dataset. It populates this with data on MIDs and civil wars based on the UCDP Armed Conflict Dataset. Since the latter requires Gleditsch-Ward state codes, these are added to the dataset prior to joining. I’ve included civil conflict data along with MIDs because past research shows that aid is linked to a lower chance of civil war. In the analysis, I want to compare how U.S. aid affects MID initiation alongside civil conflict onset. As usual, a measure of peace spells (both for MIDs and civil wars) is added to the data.
In our analysis, we’ll need to adjust for country GDP and population, which are important predictors of foreign aid giving and which also are possibly related to conflict onset. Therefore, I use add_sdp_gdp() to populate the data with these variables as well. I also add 1 year lags of each to the data.
Once the conflict dataset is created, the foreign aid data is read into R. Since we’re interested in aid from the United States to different countries, the code below filters down just to cases where the U.S. is a foreign aid donor. After some tidying up, the datasets are merged together. And with some additional cleaning up, we have a finalized dataset for analysis called Data. This cleaning up includes adding a 1 year lagged version of U.S. foreign aid. We’ll use this as our main predictor rather than the within-year version to help us address reverse causation. It’s very possible that the U.S. gives aid to countries on the basis of conflict. This would interfere with our ability to get an unbiased estimate of the effect of U.S. aid on peace. By looking at U.S. aid giving in a previous year, we can minimize this problem.
## open packages
library(tidyverse)
library(peacesciencer)
library(patchwork)
library(sandwich)
library(lmtest)
library(sjPlot)
theme_set(theme_538())

## create country-year data
create_stateyears() |>
  ## add data on MID initiation
  add_gml_mids() |>
  ## add data on civil war initiation
  add_gwcode_to_cow() |>
  add_ucdp_acd(
    type = "intrastate"
  ) |>
  ## peace spells
  drop_na(
    gmlmidonset_init,
    ucdpongoing,
    ccode, gwcode
  ) |>
  add_spells() |>
  ## population data
  add_sdp_gdp() -> Data

  ## make a lagged version of population and of GDP
Data |>
  group_by(ccode) |>
  mutate(
    lag_wbgdp2011est =
      lag(wbgdp2011est, order_by = year),
    lag_wbpopest =
      lag(wbpopest, order_by = year)
  ) |>
  ungroup() -> Data

## add foreign aid data
source("http://tinyurl.com/aiddatadownloads")
get_aiddata() |>
  ## get all possible combinations of donors and recipients
  add_full_dyads() |>
  ## drop cases that aren't countries
  drop_na(ccode_d, ccode_r) |>
  ## only keep cases with US as the donor
  filter(
    ccode_d == 2
  ) |>
  ## clean data and cross-walk
  transmute(
    ccode = ccode_r,
    year,
    aid = commitment_2011_constant
  ) -> aid_data

  ## one more thing...
  ## I want to have a "balanced panel"
expand_grid(
  ccode = unique(aid_data$ccode),
  year = unique(aid_data$year)
) |>
  left_join(
    aid_data
  ) |>
  mutate(
    aid = replace_na(aid, 0)
  ) |>
  group_by(ccode) |>
  mutate(
    lag_aid =
      lag(aid, order_by = year)
  ) -> aid_data
Data |>
  ## join the datasets
  left_join(
    aid_data
  ) |>
  ## drop the US
  filter(
    ccode != 2
  ) |>
  ## only keep possible aid recipients
  drop_na(
    aid
  ) -> Data

## finally, use some strategies to normalize aid values
Data |>
  mutate(
    aidpc = aid / exp(wbpopest),
    lag_aidpc = lag_aid / exp(lag_wbpopest),
    aidgdp = aid / exp(wbgdp2011est),
    lag_aidgdp = lag_aid / exp(lag_wbgdp2011est)
  ) -> Data
Let’s look at what’s in this dataset really quickly. First off, how many unique countries are there? According to the below code, there are 173 countries in the data. The way this dataset was constructed, to be included in the sample, a country must be in both the COW and GW state systems, and it must have been an aid recipient of some donor (whether a donor country or organization) at some point in the period included in the AidData dataset.
## unique countries in the sample
length(unique(Data$ccode))
[1] 173How about the range of years in the data? As the below code tells us, the sample runs from 1973 to 2013. This is the period of time for which we both observe aid values and conflict.
## years in the sample
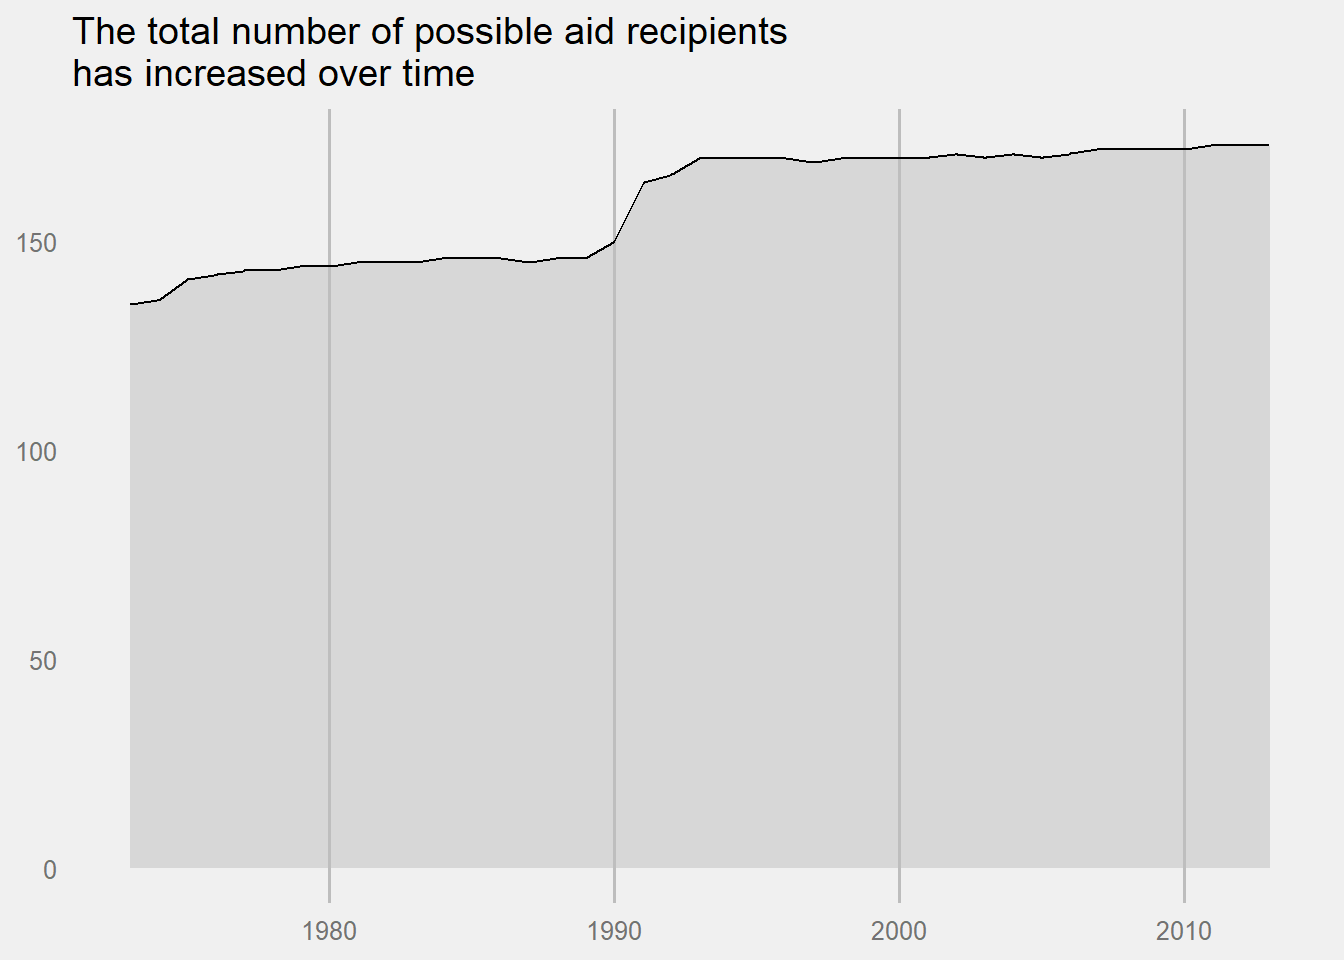
range(Data$year)[1] 1973 2013For each one of the countries in the dataset, the aid variable tells us how much foreign aid the U.S. committed to giving that country in a given year. The below figure summarizes how many countries could have hypothetically been eligible to get aid from the U.S. over the sample period. As you can see, the number has been mostly stable but increased appreciably in the early 1990s. This period coincided with the end of the Cold War when the USSR broke up into many smaller countries which could have received aid from the U.S.
## number of possible aid recipients over time in the data
Data |>
  count(year) |>
  ggplot() +
  aes(x = year, y = n) +
  geom_area(
    fill = "gray",
    color = "black",
    alpha = 0.5
  ) +
  labs(
    x = NULL,
    y = NULL,
    title = paste0(
      "The total number of possible aid recipients\n",
      "has increased over time"
    )
  )
What about the number of countries that actually received aid from the U.S. in the sample? How has this varied over time? The below figure is similar to the above except that it shows the total number of countries in the data that did receive aid from the U.S. in a given year. There is much more variation in this tally relative to what’s shown in the previous figure. It’s clear that even though there were more countries that could have received aid from the U.S. after the collapse of the USSR, the U.S. didn’t expand the scope of its aid giving in the 1990s. However, we do see an expansion around the turn of the century that roughly coincides with the infamous September 11, 2001 terrorist attacks on U.S. soil and the subsequent “war on terror.” This tells us that foreign aid was most likely used as a part of the U.S. strategy to combat global terrorism.
Data |>
  filter(aid > 0) |>
  count(year) |>
  ggplot() +
  aes(x = year, y = n) +
  geom_area(
    fill = "gray",
    color = "black",
    alpha = 0.5
  ) +
  labs(
    x = NULL,
    y = NULL,
    title = paste0(
      "The total number of actual aid recipients\n",
      "has increased over time"
    )
  )
A odd quirk of working with aid data is that its distribution is highly skewed and it has a lot of zero values. This creates a real challenge for analysis. There’s a lot of debate on how best to address this problem. Some suggest we should take the natural log of aid dollars. However, this means that zero values will be undefined. To get around this, others argue we should just manually add 1 dollar to the aid data before log transforming. This is a fine solution for some, but others don’t like that this effectively means that we’re distorting the data. A proposed alternative is to use the inverse hyperbolic sine (asinh) transformation. Under the right conditions, it gives us similar values to the natural log, but it also is defined for zero and negative values, making it more flexible. This last strategy is the one I’ve taken to using in my own research. To be sure, not everyone agrees with this approach.
The below figure helps to summarize why transforming the data is so helpful. The left panel shows the distribution of the raw aid commitment data. The right panel shows the distribution after transforming the values using the asinh transformation.
ggplot(Data) +
  aes(x = aid) +
  geom_histogram() +
  labs(
    x = NULL,
    y = NULL,
    title = "Raw Values"
  ) -> p1
ggplot(Data) +
  aes(x = asinh(aid)) +
  geom_histogram() +
  labs(
    x = NULL,
    y = NULL,
    title = "asinh-Transformed Values"
  ) -> p2
p1 + p2
`stat_bin()` using `bins = 30`. Pick better value with `binwidth`.
`stat_bin()` using `bins = 30`. Pick better value with `binwidth`.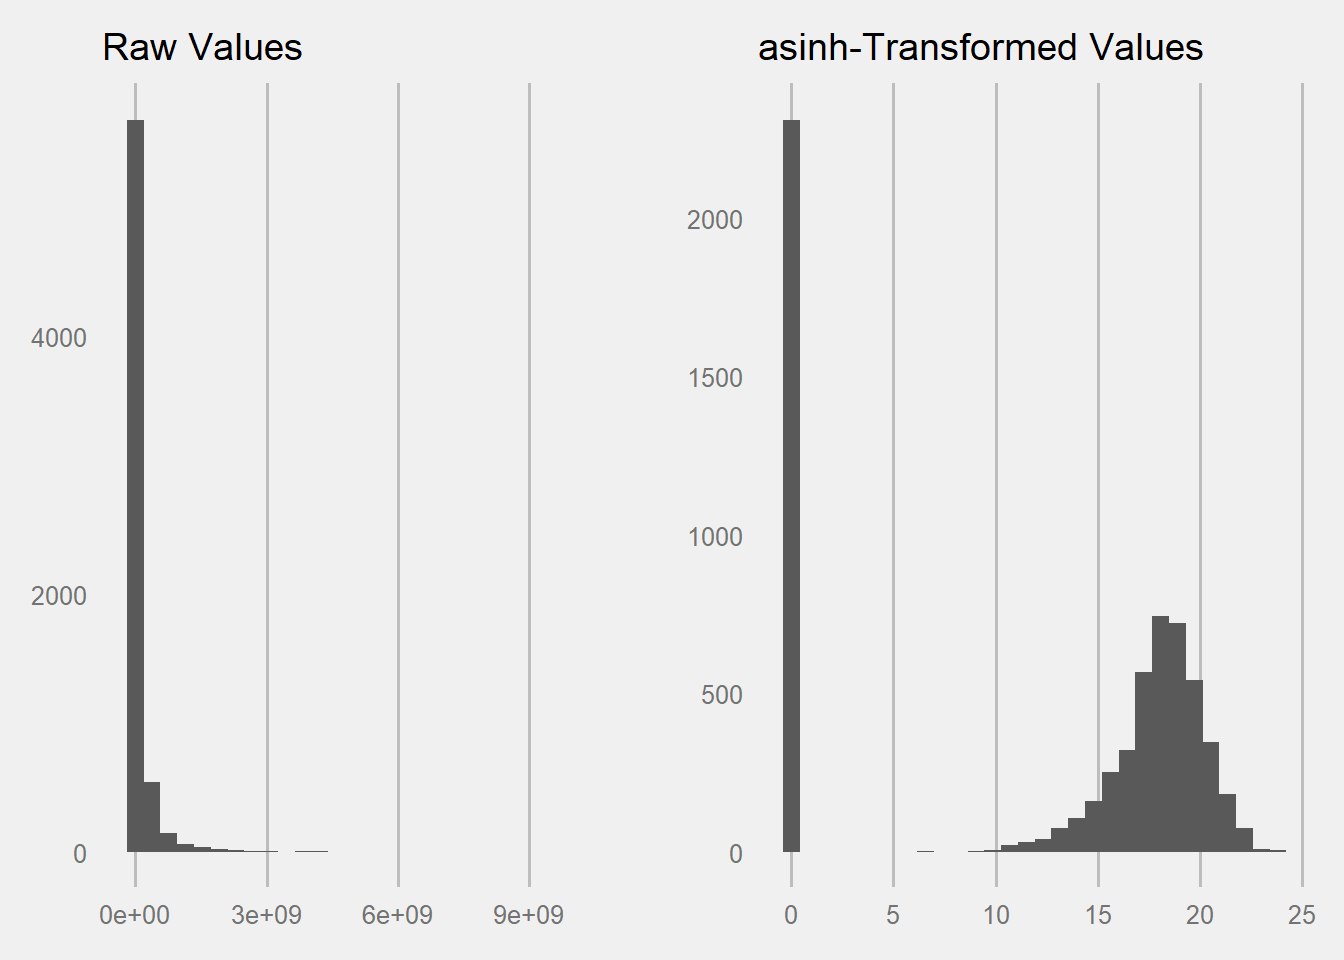
Since transforming the data is so helpful, we’ll quickly add transformed versions of the aid and lagged aid variables in the data:
Data |>
  mutate(
    asinhaid = asinh(aid),
    lag_asinhaid = asinh(lag_aid)
  ) -> Data
16.3 Analysis
Let’s get to the analysis. The below code estimates two different logit models. In one, MID initiation by a country is the outcome variable. In the other, civil conflict onset in a country is the outcome. In both models the variable lag_asinhaid is included. This is the main predictor of interest. It is the asinh-transformed measure of U.S. aid to a country in the previous year. The model also includes controls for the GDP and the population of countries in the previous year. Each of these is already log-transformed. The models, finally, are rounded off with a cubic peace trend.
## estimate model 1
glm(
  gmlmidonset_init ~
    lag_asinhaid +
    lag_wbgdp2011est +
    lag_wbpopest +
    poly(gmlmidinitspell, 3),
  data = Data,
  family = binomial
) -> fit1

## estimate model 2
glm(
  ucdponset ~
    lag_asinhaid +
    lag_wbgdp2011est +
    lag_wbpopest +
    poly(ucdpspell, 3),
  data = Data,
  family = binomial
) -> fit2
The below code summarizes the results using coeftest() and vcovCL() to compute robust standard errors clustered by country. As you can see from the direction and presence of stars (*), U.S. aid is a negative predictor of MID initiation in the following year. GDP is also a negative predictor, but it falls just shy of the usual threshold for statistical significance. Population, meanwhile, is a significant positive predictor of MID initiation in the next year. The results are slightly different for civil conflict onset. GDP and population are strong predictors for civil conflict. While higher GDP is a negative predictor of conflict the next year, higher population is a positive predictor of conflict the next year. Meanwhile, and contrary to what previous research tells us, U.S. aid has no significant relationship with the probability of civil conflict onset the next year.
options(digits = 1)
coeftest(
  fit1,
  vcov. = vcovCL(
    fit1,
    Data$ccode,
    type = "HC0"
  )
)
z test of coefficients:

                           Estimate Std. Error z value Pr(>|z|)
(Intercept)                -5.96874    0.68774   -8.68  < 2e-16 ***
lag_asinhaid               -0.02424    0.00744   -3.26   0.0011 **
lag_wbgdp2011est           -0.09831    0.05555   -1.77   0.0768 .
lag_wbpopest                0.40146    0.07551    5.32  1.1e-07 ***
poly(gmlmidinitspell, 3)1 -77.09440   13.55032   -5.69  1.3e-08 ***
poly(gmlmidinitspell, 3)2  -2.85250   19.15519   -0.15   0.8816
poly(gmlmidinitspell, 3)3 -57.81717   13.37446   -4.32  1.5e-05 ***
---
Signif. codes: 0 '***' 0.001 '**' 0.01 '*' 0.05 '.' 0.1 ' ' 1coeftest(
fit2,
vcov. = vcovCL(
fit2,
Data$ccode,
type = "HC0"
)
)
z test of coefficients:

                     Estimate Std. Error z value Pr(>|z|)
(Intercept)          -5.70220    1.77527   -3.21  0.00132 **
lag_asinhaid         -0.00817    0.01440   -0.57  0.57072
lag_wbgdp2011est     -0.41966    0.11639   -3.61  0.00031 ***
lag_wbpopest          0.73302    0.13239    5.54  3.1e-08 ***
poly(ucdpspell, 3)1 -15.98812   14.66464   -1.09  0.27560
poly(ucdpspell, 3)2 -15.90630   16.39613   -0.97  0.33198
poly(ucdpspell, 3)3 -34.97481   14.32352   -2.44  0.01462 *
---
Signif. codes:  0 '***' 0.001 '**' 0.01 '*' 0.05 '.' 0.1 ' ' 1
The figures below help to contextualize the difference in U.S. aid’s ability to predict MID initiation as opposed to civil conflict onset. As the left panel shows, U.S. aid has an obvious negative relationship with future MID initiation by the aid recipient. In the right panel, we see that the relationship between U.S. aid and future civil conflict onset is essentially a flat line.
plot_model(
  fit1,
  type = "eff",
  terms = "lag_asinhaid"
) +
  labs(
    x = "",
    y = "% Likelihood",
    title = "MID Initiation"
  ) -> p1
plot_model(
  fit2,
  type = "eff",
  terms = "lag_asinhaid"
) +
  labs(
    x = "U.S. Foreign Aid (log)",
    y = "",
    title = "Civil Conflict Onset"
  ) -> p2

p1 + p2 +
  plot_annotation(
    title = paste0(
      "The probability of international aggression declines ",
      "the more aid a country\nrecieves from the U.S. the ",
      "previous year. The probability of civil conflict\n",
      "onset remains unchanged."
    )
  ) &
  scale_y_continuous(
    n.breaks = 5,
    labels = scales::percent,
    limits = c(0, .075)
) 
16.4 Conclusion
Given how preliminary the above findings are, it’s wise to avoid making too much of them. Since, as far as I can tell, no one has really looked at the role of aid as a tool for minimizing international aggression, the example above is a very preliminary first pass at this question. Future attempts to refine the analysis may end up telling us something very different.
Nonetheless, it is interesting that U.S. aid seems to be able to promote international peace. This is consistent with incentives as a kind of international intervention that can minimize different reasons for war. Blattman (2023) talks about interventions as being best viewed as a kind of “preventive medicine.” They’re most effective at preventing war, but probably less effective at solving hard cases.
It seems that U.S. aid might be an important preventive medicine against international aggression by recipient countries. In absolute terms the preventive effect appears to be modest, so this certainly is no silver bullet. But it does generally agree with the research cited by Blattman (2023) which shows interventions, at best, are marginally effective. Modest progress is often all we can hope for when it comes to solving a problem as complex as war.