How can asking a bunch of indirect questions help us measure one unique concept?
How do we go about combining responses from many questions into one index?
Can we be sure that our index is trustworthy?
12.2 Why we need indexes
As we discussed in the previous chapter, indexes are constructed with survey data to measure concepts that are hard to get at using direct questions. You can’t ask someone how racist or sexist they are. You also can’t ask someone how knowledgeable they are about politics. People will give you biased responses to these questions. Because of social desirability bias, they’ll under-report levels of racism and sexism, and because of a phenomenon known as the Dunning-Kruger effect, they’ll over-report levels of knowledge.
One solution to this problem is to ask a battery of questions that indirectly measures a concept of interest. The term “battery” just means that we’re using many related questions, and the idea is that we can use these questions to triangulate attitudes or characteristics that are impossible to measure directly.
A good example is a battery of questions used to calculate political knowledge, which is useful to measure if want to know whether knowledgeable voters in a democracy are more likely to be involved in politics relative to low-knowledge voters. This battery would consist of several questions that test factual knowledge about politics, like whether someone knows the names of heads of government, the names of the major political parties, and so on. The idea is to have people take a political knowledge test, which should provide a more reliable measure of their level of knowledge than you could get by asking them to self-report how knowledgeable they are.
12.3 The risks of making an index
To process of index creation is simple in principal, but in practice a number of issues can crop up. Two in particular are (1) the need to ensure that questions in the battery are relevant to the concept you want to measure and (2) the tension between the size of the battery and respondent patience.
For the first issue, question relevance can make or break the validity of an index. For measuring a concept like political knowledge, you have to think carefully about what kinds of knowledge matter. Should you focus on knowledge about certain issues? Is it enough if people know the names of key players in politics? Should we check whether people are aware of their social rights or what’s in their country’s constitution?
If you want to measure something like racism, the problems are compounded. You’ll have to define the scope of attitudes we might associate with racism and ensure that these attitudes are as universal in their applicability as possible. If you ask irrelevant questions, don’t be surprised to have an irrelevant index.
In addition to making sure you ask relevant questions, you also have to consider how many questions to ask. If you present a survey respondent with too many, they may get impatient and skip a bunch of questions or make errors in answering them. However, if you present a respondent with too few questions, you may miss out on important dimensions of the concept you want to measure, giving you an overall less precise index.
The process of index creation is more art than science. A lot of judgment calls are required, and no two researchers will make the same choices. They might disagree about which questions are relevant for measuring a concept. They might also disagree about the trade-offs between a long versus short battery. Building a convincing theoretical argument and practical justification for choices made is essential if researchers want others to trust their measure. Often, those whose approaches receive the widest reception are either those who were the first to measure a concept in a survey and/or those who are the best writers—while we may not like it, those who write best win the day rather than those with the best ideas.
12.4 Measuring “racial animus” with the What the Hell Happened survey
In the last chapter I introduced the What the Hell Happened (WTHH) survey, which was fielded in 2018 by Data for Progress to understand the factors that led to Donald Trump beating Hillary Clinton in the 2016 US President election. Racial animus, or racism, was among many attitudes and factors the survey was intended to capture. This concept, as Data for Progress defines it, centers on the degree to which individuals harbor hostility or ill-feeling toward racial minorities (black Americans in particular).
Data for Progress decided to measure racial animus using a battery of questions. Using responses from these questions, an index was constructed based on the summed responses of individuals to a series of questions about racial attitudes. None of these questions directly asked people whether they harbor ill-feeling toward racial minorities, nor did they directly ask if someone was a racist. Instead, people were asked about their agreement with certain statements about the legacy of slavery, whether individuals believe that racial problems are isolated or systemic, and whether racism made them angry.
If you look at the codebook for the WTHH survey, you’ll see that five questions in total were used to construct the racial animus index. They asked respondents to indicate their level of agreement with the following statements:
[GENERATIONS] Generations of slavery and discrimination have created conditions that make it difficult for African Americans to work their way out of the lower class.
[FAVORS] Irish, Italian, Jewish, and many other minorities overcame prejudice and worked their way up. Blacks should do the same without any special favors.
[INSTITUTIONS] White people in the U.S. have certain advantages because of the color of their skin.
[SYSTEM] Racial problems in the U.S. are rare, isolated situations.
[EMPATHY] I am angry that racism exists.
Possible responses to these questions were: (1) Strongly agree, (2) Somewhat agree (3) Neither agree nor disagree, (4) Somewhat disagree, (5) Strongly disagree, (6) No opinion.
Racial animus was coded from responses to the above questions by taking the sum of (“strongly agree” = 4, “somewhat agree” = 3, “neither agree nor disagree” = 2, “somewhat disagree” = 1, “strongly disagree” = 0) for SYSTEM and FAVORS, plus the sum of (“strongly agree” = 0, “somewhat agree” = 1, “neither agree nor disagree” = 2, “somewhat disagree” = 3, “strongly disagree” = 4) for EMPATHY, INSTITUTION, and GENERATIONS.
We can take a look in the WTHH data to see what this measure and its components look like.
## packageslibrary(tidyverse)
Warning: package 'tidyverse' was built under R version 4.2.3
Warning: package 'ggplot2' was built under R version 4.2.3
Warning: package 'tibble' was built under R version 4.2.3
Warning: package 'tidyr' was built under R version 4.2.3
Warning: package 'readr' was built under R version 4.2.3
Warning: package 'purrr' was built under R version 4.2.3
Warning: package 'dplyr' was built under R version 4.2.3
Warning: package 'stringr' was built under R version 4.2.3
Warning: package 'forcats' was built under R version 4.2.3
Warning: package 'lubridate' was built under R version 4.2.3
── Attaching core tidyverse packages ──────────────────────── tidyverse 2.0.0 ──
✔ dplyr     1.1.2     ✔ readr     2.1.4
✔ forcats   1.0.0     ✔ stringr   1.5.0
✔ ggplot2   3.5.0     ✔ tibble    3.2.1
✔ lubridate 1.9.3     ✔ tidyr     1.3.0
✔ purrr     1.0.2
── Conflicts ────────────────────────────────────────── tidyverse_conflicts() ──
✖ dplyr::filter() masks stats::filter()
✖ dplyr::lag()    masks stats::lag()
ℹ Use the conflicted package (<http://conflicted.r-lib.org/>) to force all conflicts to become errors
library(socsci)
Loading required package: rlang
Warning: package 'rlang' was built under R version 4.2.3
Attaching package: 'rlang'

The following objects are masked from 'package:purrr':

    %@%, flatten, flatten_chr, flatten_dbl, flatten_int, flatten_lgl,
    flatten_raw, invoke, splice

Loading required package: scales
Warning: package 'scales' was built under R version 4.2.3
Attaching package: 'scales'

The following object is masked from 'package:purrr':

    discard

The following object is masked from 'package:readr':

    col_factor

Loading required package: broom
Warning: package 'broom' was built under R version 4.2.3
Warning: One or more parsing issues, call `problems()` on your data frame for details,
e.g.:
  dat <- vroom(...)
  problems(dat)
Rows: 3215 Columns: 222
── Column specification ────────────────────────────────────────────────────────
Delimiter: ","
chr   (9): state, senvote18_t, senvote18_undecided_t, housevote18_t, govvote...
dbl (204): rowid, votereg, birthyr, age5, gender, has_voted, pp18_votelikely...
lgl   (9): race_t, specsenvote18_t, specsenvote18_undecided_t, housevote18_u...

ℹ Use `spec()` to retrieve the full column specification for this data.
ℹ Specify the column types or set `show_col_types = FALSE` to quiet this message.
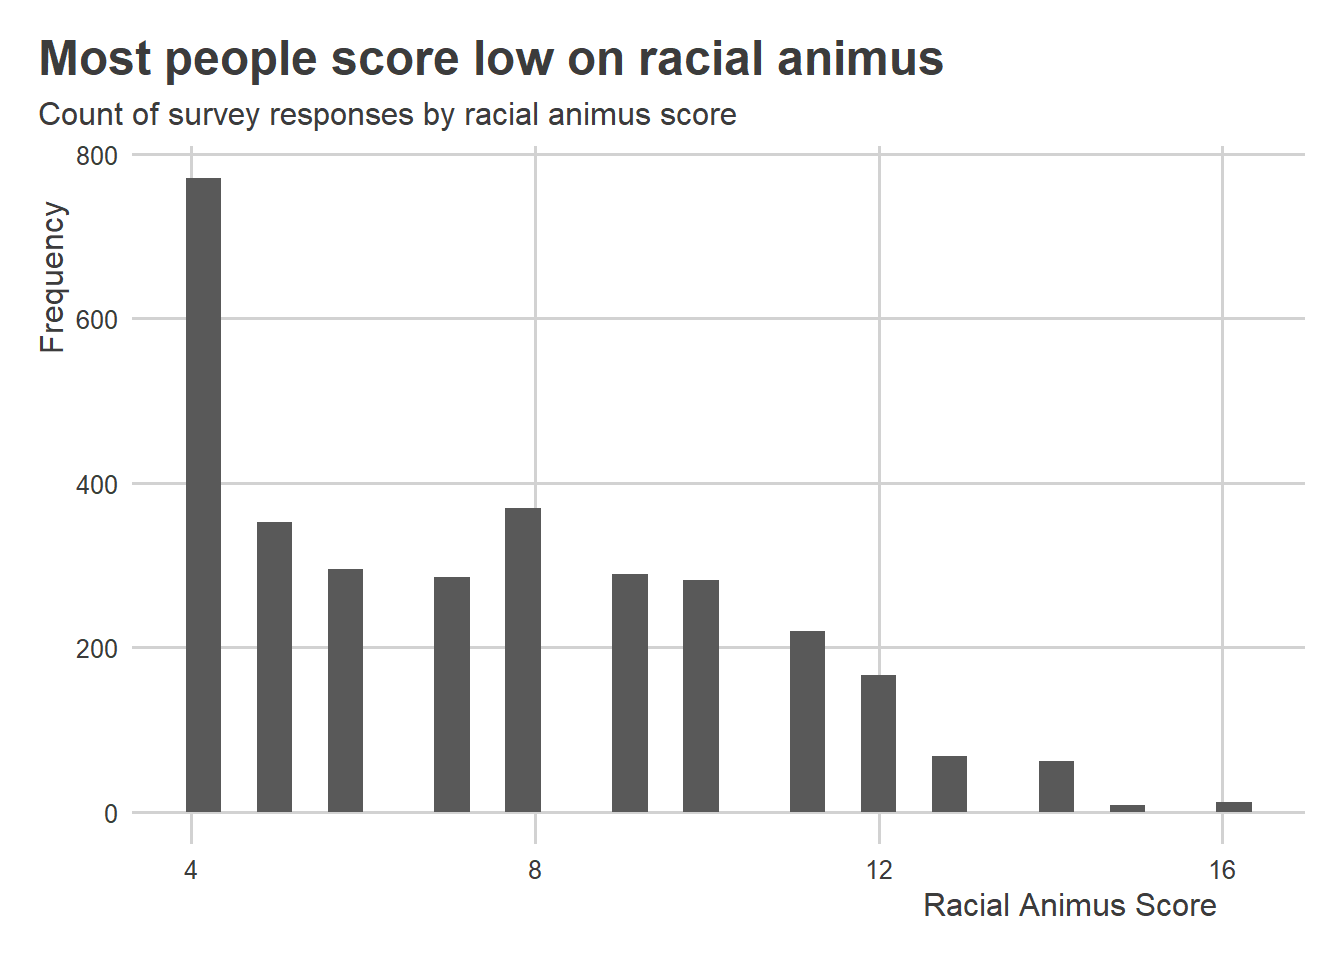
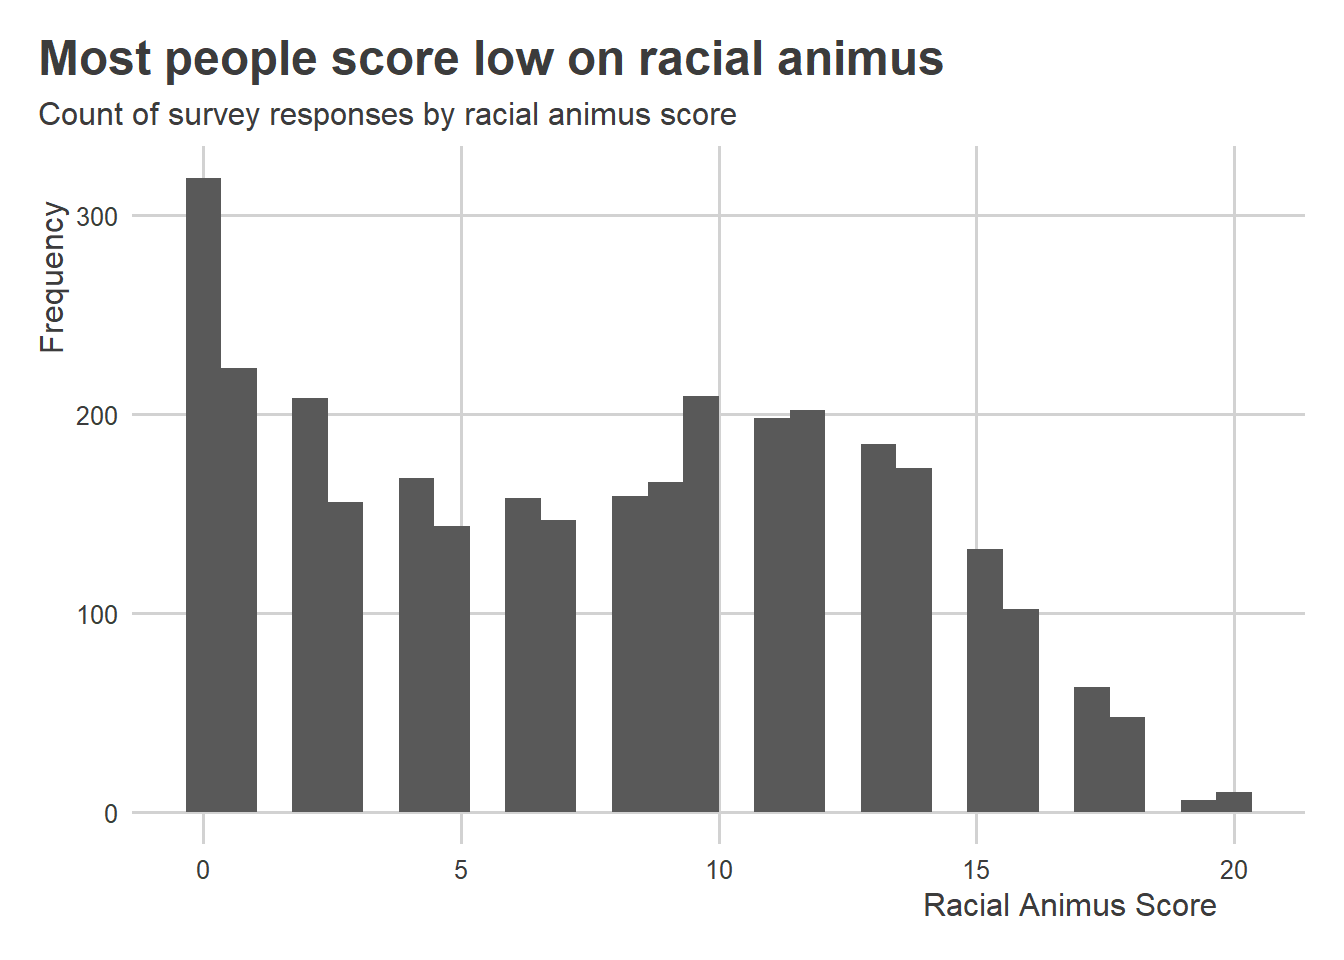
Data for Progress already added the racial animus index as a variable to their data. It’s the column called racial_resentment_raw. The below code makes a histogram that shows its distribution. Higher values indicate more racism. Based on the distribution, it looks like most of the people who took the survey score low on the racial animus scale (we should be happy about that, by the way).
ggplot(wthh) +aes(x = racial_resentment_raw) +geom_histogram() +labs(x ="Racial Animus Score",y ="Frequency",title ="Most people score low on racial animus",subtitle ="Count of survey responses by racial animus score" )
`stat_bin()` using `bins = 30`. Pick better value with `binwidth`.
Warning: Removed 34 rows containing non-finite outside the scale range
(`stat_bin()`).
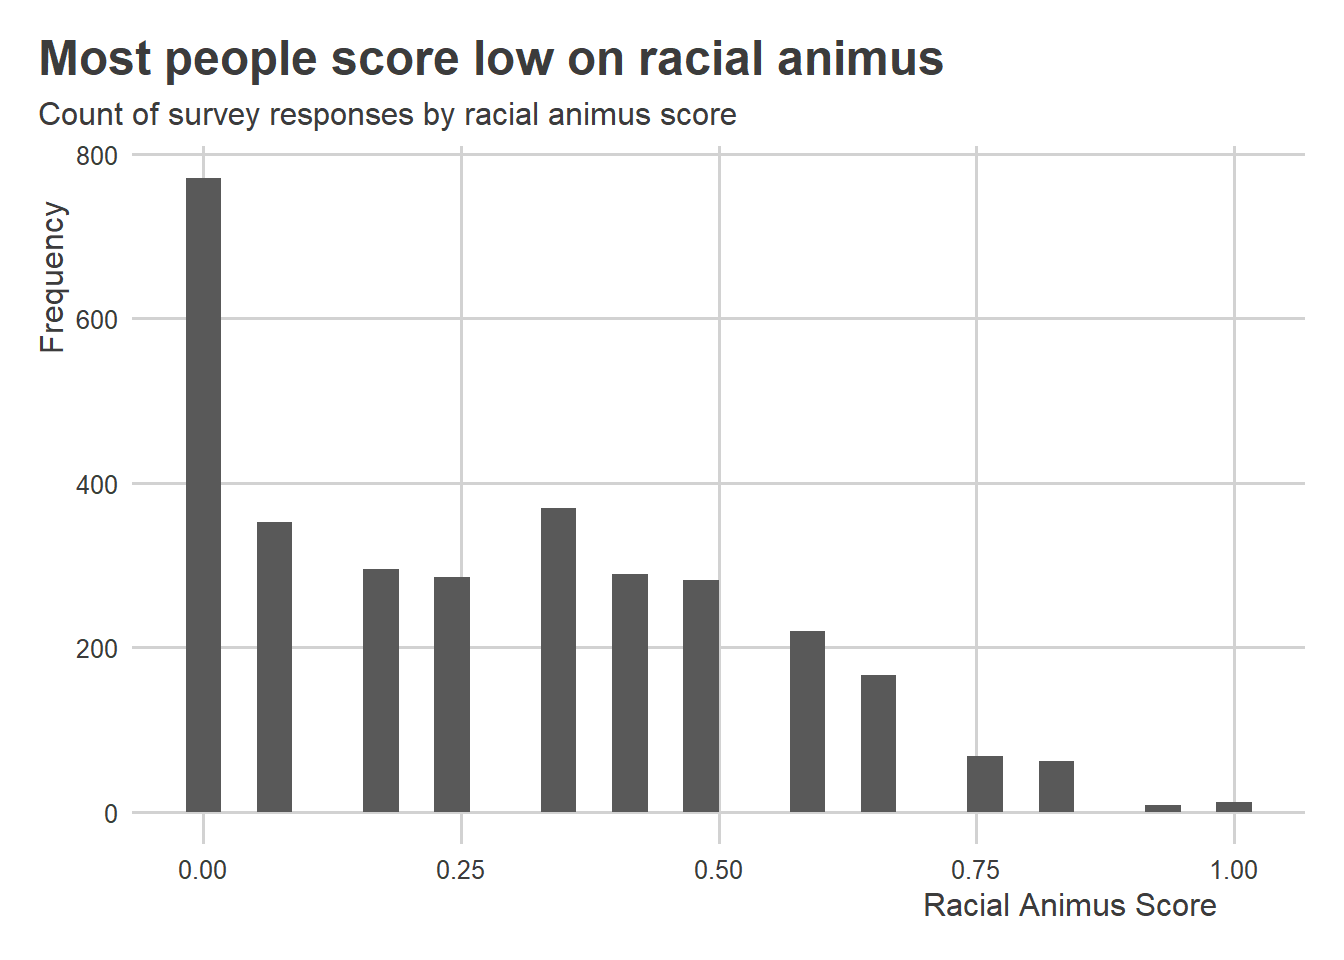
There is a second version of the measure as well that has been re-scaled to take on values between 0 and 1. Here’s some code that makes a histogram just like the previous one, but with the re-scaled measure of racial animus. The distribution is identical apart from, well, the scale.
ggplot(wthh) +aes(x = racial_resentment_scaled) +geom_histogram() +labs(x ="Racial Animus Score",y ="Frequency",title ="Most people score low on racial animus",subtitle ="Count of survey responses by racial animus score" )
`stat_bin()` using `bins = 30`. Pick better value with `binwidth`.
Warning: Removed 34 rows containing non-finite outside the scale range
(`stat_bin()`).
While Data for Progress did us a favor by constructing this index for us, we can also follow their summary of how they constructed it to do it ourselves. The below code generates a new racial animus score from the raw responses to the five questions noted above. I based the recodes on the description in the WTHH codebook.
wthh |>mutate(## first convert 6 (no opinion) to 2 (neither agree nor dis)## and subtract 1 to put on a 0:4 scaleacross(c( GENERATIONS, FAVORS, INSTITUTION, SYSTEM, EMPATHY ),~ifelse(.x ==6, 3, .x) -1,.names ="{.col}_2"# update as new columns ),SYSTEM_2 =4- SYSTEM_2,FAVORS_2 =4- FAVORS_2,## make the indexracial_animus = SYSTEM_2 + FAVORS_2 + GENERATIONS_2 + INSTITUTION_2 + EMPATHY_2 ) -> wthh
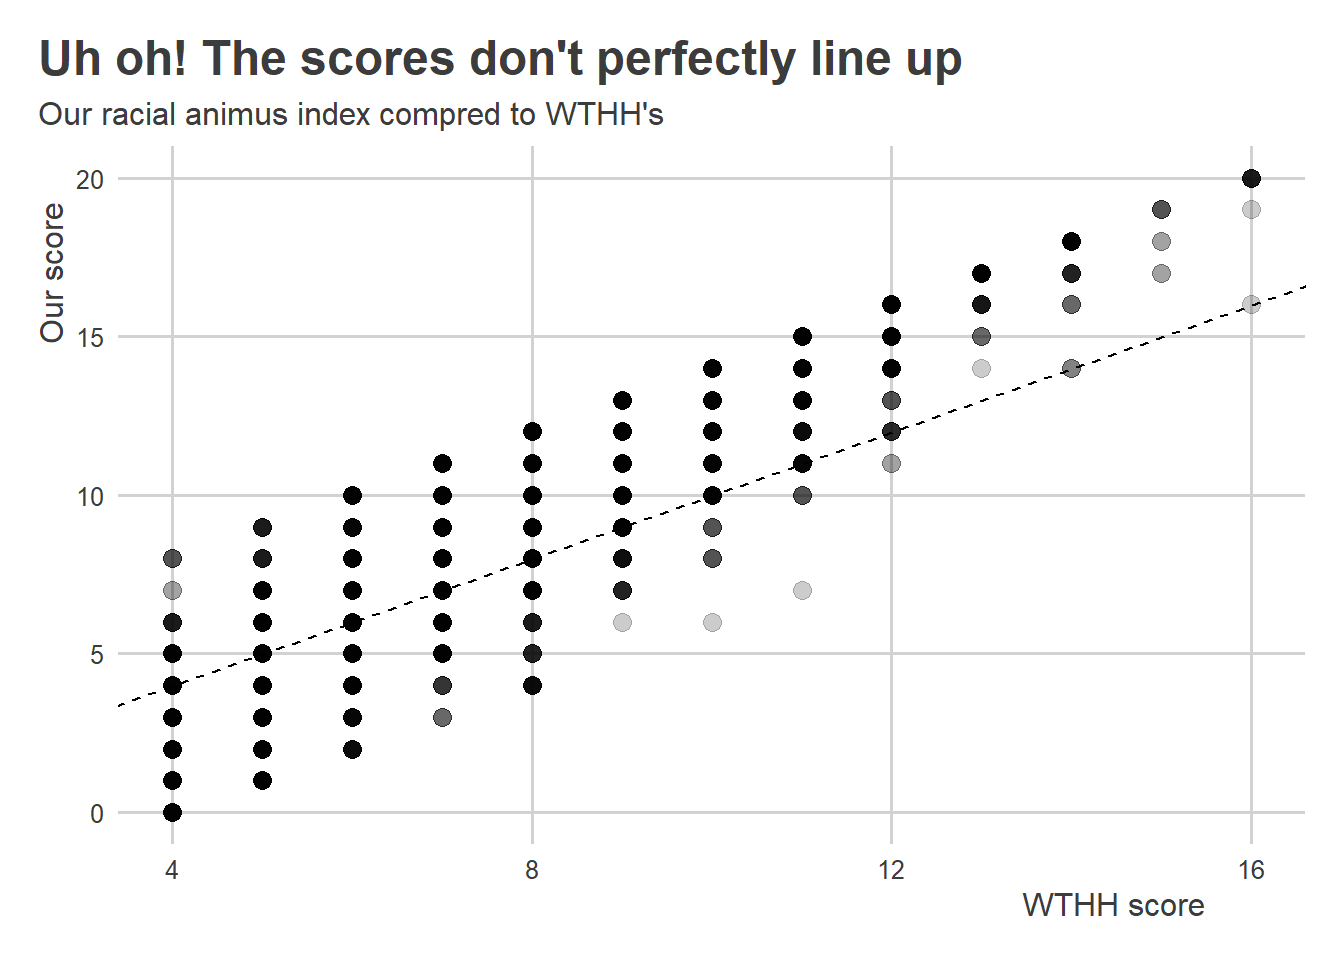
Let’s compare racial_animus with racial_resentment_raw to see if they line up. The below code makes a scatter plot with a 45 degree line running through it. WTHH’s version of racial animus is on the x-axis and the one I made is on the y-axis. As you can see, these measures are strongly correlated, but, worryingly, they aren’t identical.
ggplot(wthh) +aes(x = racial_resentment_raw, y = racial_animus) +geom_point(size =3,alpha =0.2 ) +geom_abline(slope =1,intercept =0,lty =2 ) +labs(x ="WTHH score",y ="Our score",title ="Uh oh! The scores don't perfectly line up",subtitle ="Our racial animus index compred to WTHH's" )
Warning: Removed 39 rows containing missing values or values outside the scale range
(`geom_point()`).
This is an important lesson in making sure that we double check the work of others. While the WTHH racial animus index is positively correlated with ours, there are more than a few scores that don’t perfectly line up. Here’s some code we can run to check how many:
Wow, so over 86% of the scores don’t perfectly match. What could have gone wrong here? It turns out that people make mistakes when they write codebooks and when they write code. In this case, I think our code is correct. I also made one slight innovation in writing the code to make our scores better align with Data for Progress’s by recoding “6” values (“no opinion”) to “2s” (“neither agree nor disagree”). But that fix still leaves a ton of discrepancies.
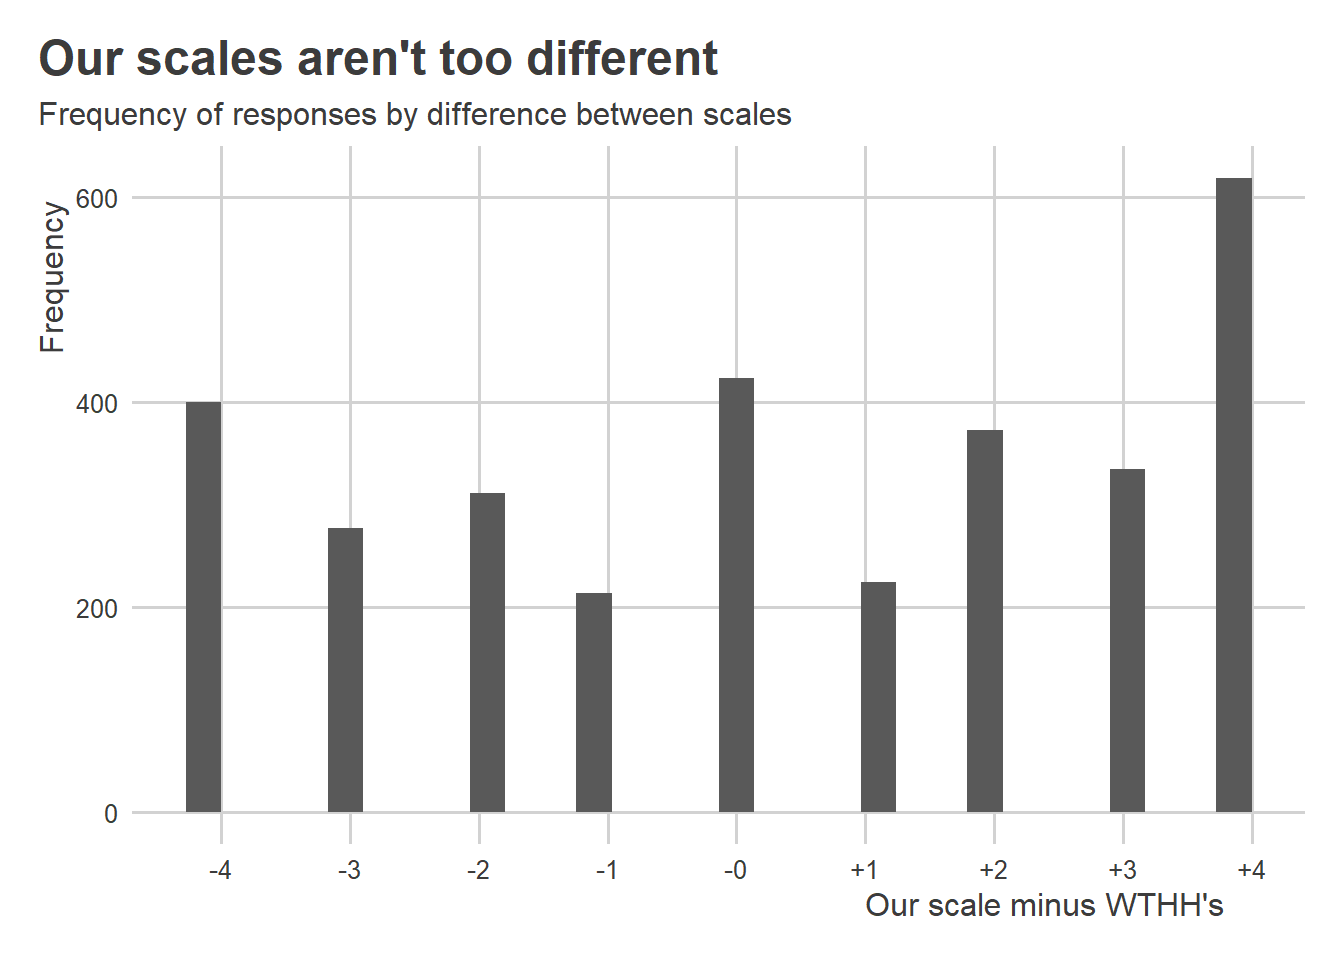
Now, we shouldn’t overstate this problem, because in many cases the difference isn’t large. But as the below figure shows, the scales can be off by as much as +/-4 points on a measure that can in principal take values from 0 to 20. That’s a big margin of error.
ggplot(wthh) +aes(x = racial_animus - racial_resentment_raw ) +geom_histogram() +labs(x ="Our scale minus WTHH's",y ="Frequency",title ="Our scales aren't too different",subtitle ="Frequency of responses by difference between scales" ) +scale_x_continuous(breaks =seq(-4, 4, by =1),labels =~paste0(ifelse(.x >0, "+", "-"),abs(.x) ) )
`stat_bin()` using `bins = 30`. Pick better value with `binwidth`.
Warning: Removed 39 rows containing non-finite outside the scale range
(`stat_bin()`).
These differences aside, the main issue we should consider is whether our index tells us something substantively different about the pattern of racism in the sample. As the below histogram indicates, there isn’t really much material difference. Lower scores are much more common than higher scores, which is what WTHH’s index tells us too.
ggplot(wthh) +aes(x = racial_animus) +geom_histogram() +labs(x ="Racial Animus Score",y ="Frequency",title ="Most people score low on racial animus",subtitle ="Count of survey responses by racial animus score" )
`stat_bin()` using `bins = 30`. Pick better value with `binwidth`.
Warning: Removed 39 rows containing non-finite outside the scale range
(`stat_bin()`).
Most indexes are constructed in this way or via a similar method. While WTHH’s index is a sum of responses, others take averages. Also, just like WTHH’s approach, many researchers re-scale indexes to fall on a consistent and intuitive scale (such as 0-1).
The choice to take the sum or the mean generally doesn’t make a difference, but it will if there are missing data points for some of the questions that go into an index. Often times survey respondents might not respond to all the questions in a battery. When this happens some people just take the average of the responses that are valid to recover a measure for people who don’t finish every question. This isn’t a perfect solution, but it gives you more valid data to work with.
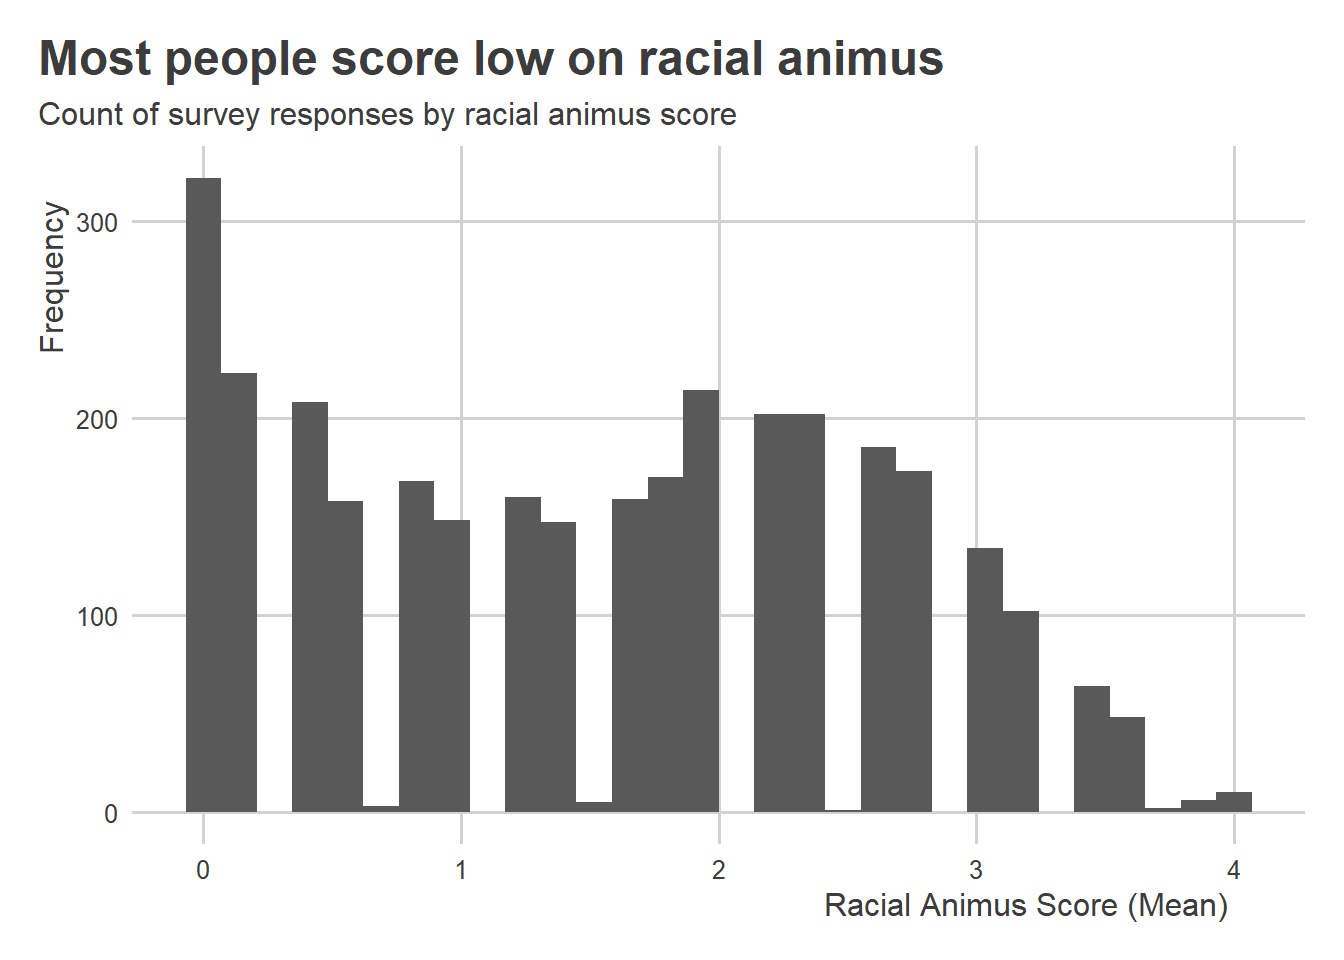
As it happens, there are some missing responses in the five questions in the racial animus battery. To make a valid measure for as many observations as possible, we can use the below code to construct the racial animus measure instead. It calculates an average racial animus score that drops any responses from the average that have a missing value. For example, if someone didn’t answer the question about the impact of slavery, but they did answer the remaining four questions in the battery, this code just takes the average response to those four questions. Note the use of rowwise() and c_across(). The first is a special grouping function that tells mutate() that any operations it applies, like taking the mean, should be done across columns rather than within a column like it normally would. The c_across() function indicates which columns the operation of interest should be applied to. In words, the below code takes the mean across the five columns of interest by rows in the data.
Here’s what this more complete version of the measure looks like. It’s about the same, but we’ve recovered a score for some additional survey respondents.
ggplot(wthh) +aes(x = racial_animus_mean) +geom_histogram() +labs(x ="Racial Animus Score (Mean)",y ="Frequency",title ="Most people score low on racial animus",subtitle ="Count of survey responses by racial animus score" )
`stat_bin()` using `bins = 30`. Pick better value with `binwidth`.
Warning: Removed 1 row containing non-finite outside the scale range
(`stat_bin()`).
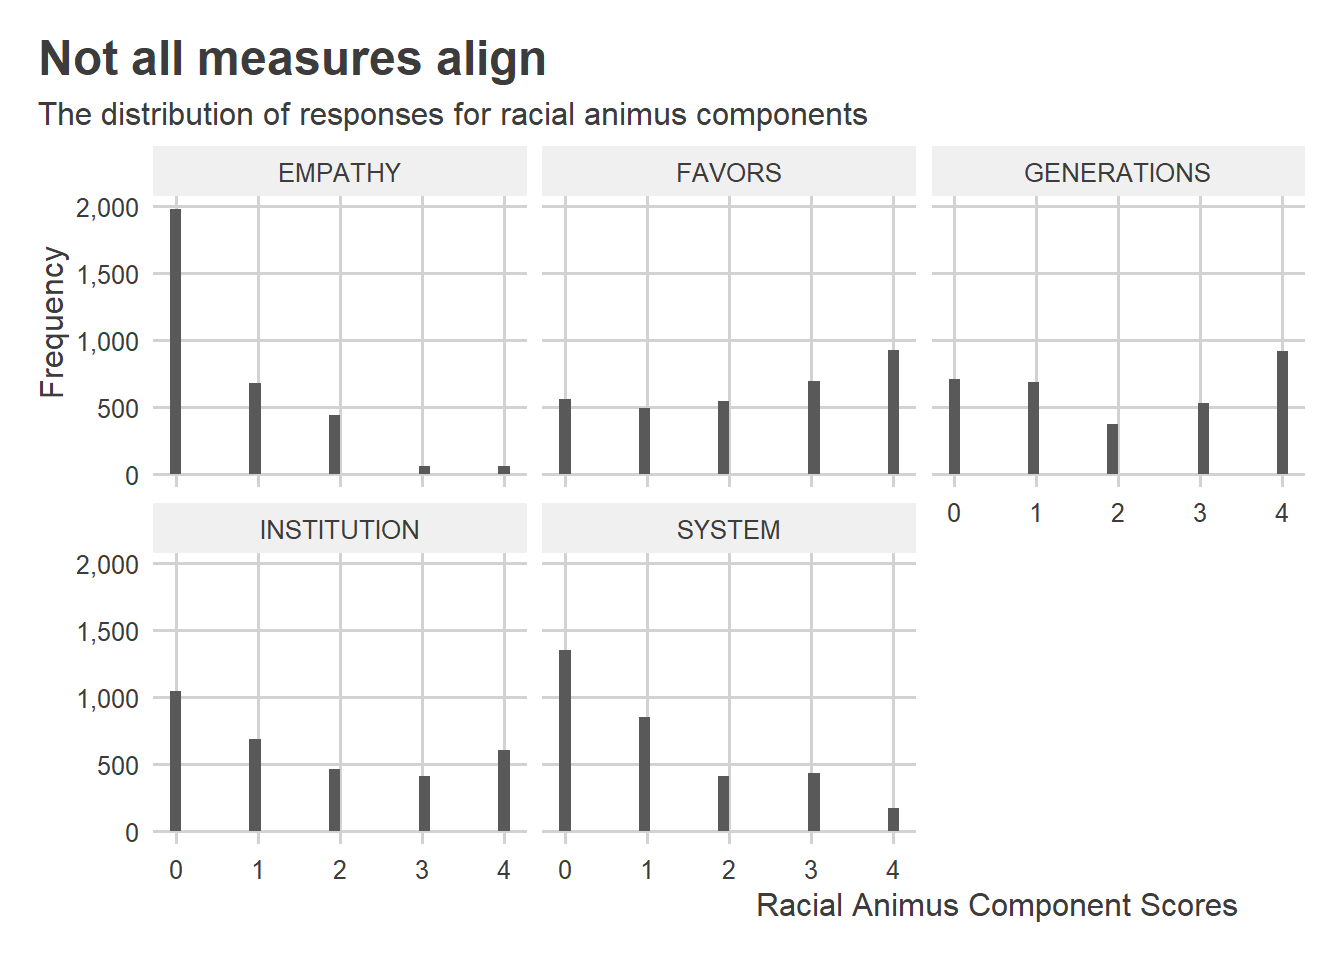
Any time we make an index, it’s always good practice to check the distribution of the components that go into it. The below code makes a small multiple, faceting a histogram by the five measures that go into the racial animus index. Responses to the statements about EMAPTHY and SYSTEM look much different from the others. Generally, many more respondents feel angry about racism and don’t think discrimination is an isolated event. But there’s much more dispersion in responses for the remaining questions.
`stat_bin()` using `bins = 30`. Pick better value with `binwidth`.
Warning: Removed 44 rows containing non-finite outside the scale range
(`stat_bin()`).
12.5 Can we trust racial animus scores?
Technical issues with index construction aside, a big conceptual question we need to ask is whether our index is a reliable measure. Racial animus is supposed to capture hostility or ill-feeling toward racial minorities, and toward black citizens in particular. Let’s take a closer look at the questions that go into this metric to see if it’s really capturing this idea. Each of the five questions asked about whether respondents agree or disagree with a certain statement. These were listed in the previous section, but I want to briefly mention them again and point out how agreement/disagreement with them contributes to measured racial animus.
First, respondents were asked how much they agree with the statement: “Generations of slavery and discrimination have created conditions that make it difficult for African Americans to work their way out of the lower class.” The racial animus index is constructed such that the more you disagree with this statement, the more racial animus you have. The idea is that the history of slavery and discrimination against blacks in the United States generates lingering disadvantages for black Americans, and failing to recognize this is interpreted as hostility or ill-feeling toward black citizens.
Second, respondents were asked whether they agree that: “Irish, Italian, Jewish, and many other minorities overcame prejudice and worked their way up. Blacks should do the same without any special favors.” Racial animus is coded such that more agreement with this indicates higher racial animus. This question is trying to pick up on factors complementary with the previous one by measuring how dismissive someone is of the unique historical disadvantages that black Americans have faced and whether they think actions must be taken to help.
The third question asked respondents to rate their level of agreement with the statement: “White people in the U.S. have certain advantages because of the color of their skin.” Less agreement with this statement equates to a higher racial animus score. This question is meant to pick up recognition of institutionalized factors that disproportionately benefit white Americans.
The fourth statement was: “Racial problems in the U.S. are rare, isolated situations.” More agreement with this statement contributes to a higher racial animus score. This question is intended to pick up whether individuals recognize the systemic nature of racial discrimination against blacks in the United States. If you see incidents of discrimination as primarily isolated, you are treated as having more racial hostility.
Finally, respondents where asked to rate their level of agreement with the statement: “I am angry that racism exists.” More disagreement leads to a higher racial animus score. The idea is that if you don’t have a strong negative and emotional response to racism, you must harbor hostile feelings toward racial minorities.
Taken together, I think one can see that an index constructed from responses to these questions is going to be correlated with the concept of racial animus, but it won’t perfectly reflect it. In the social sciences, our measures of concepts are never going to be a perfect representation of the actual things we want to study. I like the way political scientist David Lake puts it: “All theoretical constructs are measured only indirectly, akin to seeing shadows cast on a wall rather than objects themselves.” If you’re unfamiliar with Plato’s cave allegory, you should look it up, because Lake is channeling it. The point is that a concept like racism is abstract and we can’t measure it directly. There’s no racism thermometer that you can put in someone’s ear to gauge exactly how racist that person is. But while we can’t observe racism itself, we can observe the ways it manifests and try to measure those things, and ideally we should measure as many different manifestations of it as we can. To belabor the shadow illustration, we can shine a light on racism from many different angles and see how its shadow changes shape on the wall. If we can capture shadows of racism from enough angles, the hope is that we can get a rough measure of racism itself even though we can’t directly see it.
Of course, some constellations of shadows will be more informative than others. Obviously the more complex a concept, the more shadows we need from different angles to make out its profile. It shouldn’t take too many passes with a sphere to make out its overall shape, but good luck using shadows to make out an object like a Wendelstien 7-X Stellarator. But more shadows alone are insufficient. The angle of those shadows matters, too. Many concepts that we care about in the social sciences, such as racism, are multi-dimensional, and that means we need to measure their shadows from many different directions. This isn’t always easy to do.
And it gets worse. Racism isn’t just floating out in the ether, unconnected from other concepts. Countless overlapping theoretical constructs are in the mix too. That means when we cast a light on racism from a particular angle, we’ll see the shadows of other things that are nearby. Take the statement: “Irish, Italian, Jewish, and many other minorities overcame prejudice and worked their way up. Blacks should do the same without any special favors.” Agreement with this statement is one shadow cast from racism that we can observe, but we probably aren’t only seeing racism in its shadow. Aspects of this question might also trigger someone to think about fairness. A respondent might read this statement and think it is unfair that other minorities didn’t receive help overcoming prejudice while black Americans do. To the extent that ideas about unfairness make their way into our racial animus index, it fails to perfectly capture the concept of racism.
You could critique the other questions that go into the racial animus index as well. While it’s probably true that someone with racial animus will answer those questions in the expected way, those without racial animus will probably also answer affirmatively, but for reasons that have nothing to do with ill-feeling toward black Americans.
This leads to a simple question: can we trust the racial animus index on the whole? To answer this question we need a definition for trustworthiness. According to ChatGPT “the quality of being dependable and deserving of trust or confidence” is the essence of trustworthiness, and who am I to question our AI overlords? But if pressed to whittle this definition down, however, I think the key word I would focus on is dependable. Synonyms include reliable and predictable. A trustworthy measure of racism should dependably or reliably capture variation in how racist a person is.
By the strict definition of trustworthiness, I think Data for Progress’s racial animus index fails the test. There are flaws in the way each of the questions casts a light on racism, so our empirical measure of the concept will never be a true reflection of racism itself.
But I think we should evaluate trustworthiness in a way that differs from its strict definition. Trustworthy could also mean useful. The fact that a set of questions are flawed doesn’t mean that a measure built from them is useless. Sure, any one of the questions that goes into the racial animus index is probably inadequate as a measure of racism on its own. But when combined together, as long as these questions cast a light on racism from enough angles, our rough, shadowy outline of it can be good enough to directionaly say whether one person appears to be more racist than another, on average.
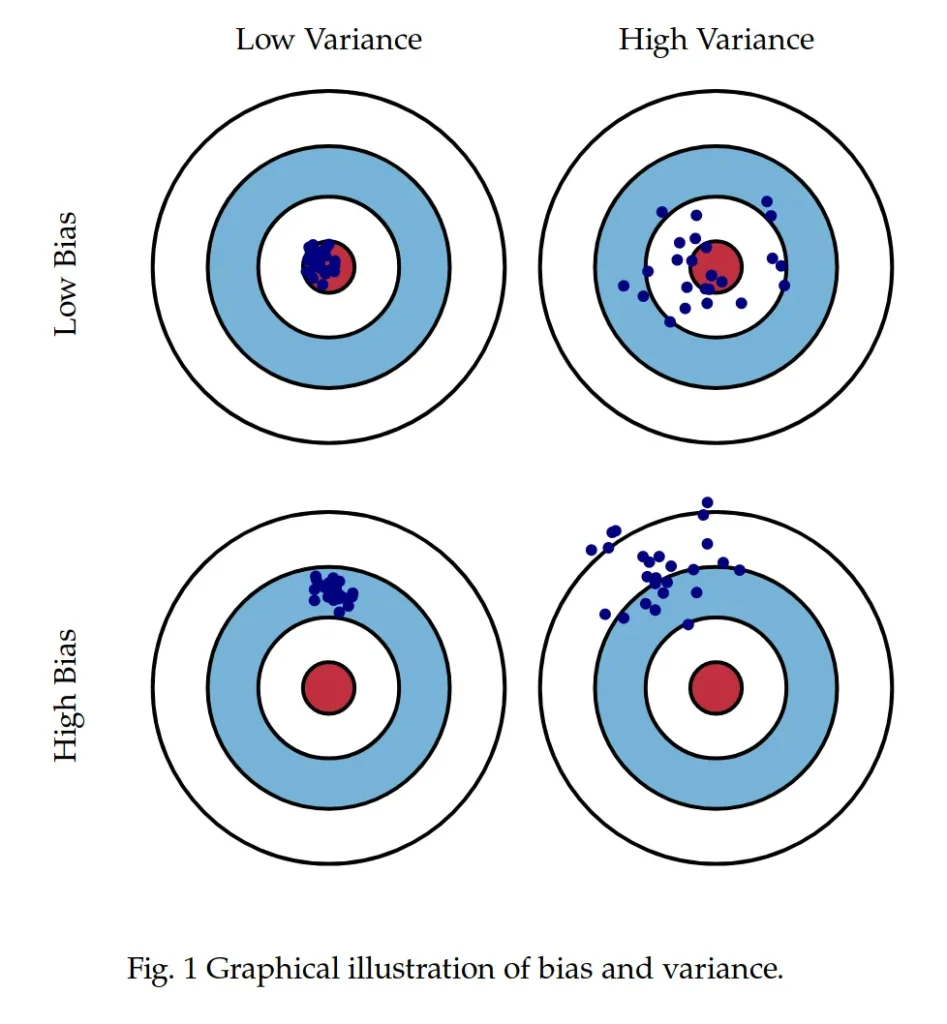
This discussion provides an opportunity to address two key concepts that go into our evaluation of the trustworthiness of a measure—what some call measurement validity. The first is called bias, and the other is called variance. A valid or trustworthy measure is low in bias and low in variance. An invalid and untrustworthy measure is high in bias and high in variance.
These concepts are on a continuum. They also are orthogonal, which is a fancy term that means unrelated. A measure could be low in bias and also high in variance. It could also be high in bias but low in variance. The below image, taken from an online article by Scott Formann-Roe, illustrates what the combinations could look like using a bullseye.
For obvious reasons, I’d prefer to have a low bias, low variance measure. A second best would be a low bias but high variance one. I’m torn between which of the last two options I’d prefer least—I think I’d hate being precisely wrong as much as being imprecisely wrong. Either way, I’m wrong.
So, where does racial animus fit along the bias-variance continuum? I’ll leave you to ponder the answer to this question. The bigger point I want to make is that you need to think carefully about how you construct an index. You never are going to produce a perfect measure, but perfection shouldn’t be your threshold for acceptable measurement anyway. Rather, you should consider whether your measure is useful. How biased do you think it is, and can you tell which direction the bias goes? How variable or noisy is the measure? These should be your criteria for judging an index’s trustworthiness.